TECHNICAL ASSET FINGERPRINT
570358fbe9de0ae2636ab1b3
Click to view fullscreen
Press ESC or click to close
FOUND IN PAPERS
EXPERT: healer-alpha-free VERSION 1
RUNTIME: free/openrouter/healer-alpha
INTEL_VERIFIED
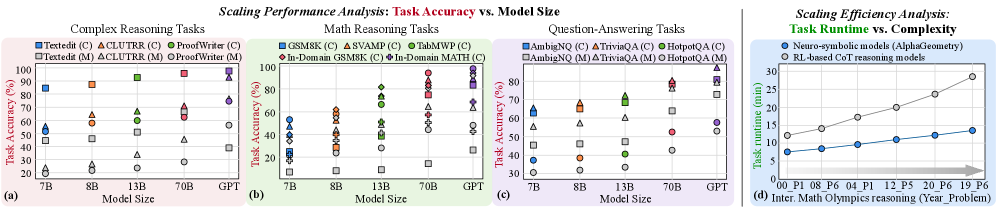
## Scaling Performance Analysis: Task Accuracy vs. Model Size & Scaling Efficiency Analysis: Task Runtime vs. Complexity
### Overview
The image is a composite figure containing four distinct charts, labeled (a), (b), (c), and (d). The first three charts (a, b, c) are scatter plots analyzing the relationship between **Model Size** and **Task Accuracy (%)** across different task categories. The fourth chart (d) is a line graph comparing the **Task runtime (min)** of two different model types against increasing problem complexity. The overall theme is the scaling behavior of AI models in terms of accuracy and computational efficiency.
### Components/Axes
**Common Elements (Charts a, b, c):**
* **X-Axis:** "Model Size" with categorical markers: `7B`, `8B`, `13B`, `70B`, `GPT`.
* **Y-Axis:** "Task Accuracy (%)" with a linear scale from 0 to 100, marked at intervals of 20.
* **Legends:** Each chart has a legend positioned in the top-left corner, listing specific tasks with unique color and marker shape combinations. The legend distinguishes between two variants for each task, denoted by `(C)` and `(M)`.
* **Data Points:** Each data point is a marker (circle, square, triangle, etc.) representing the accuracy of a specific task variant on a specific model size.
**Chart (d) Specifics:**
* **Title:** "Scaling Efficiency Analysis: Task Runtime vs. Complexity"
* **X-Axis:** "Inter. Math Olympiad reasoning (Year_Problem)" with categorical labels: `P01_P08`, `P06_P12`, `P04_P12`, `P12_P15`, `P20_P16`, `P19_P6`. These likely represent problem sets from different years.
* **Y-Axis:** "Task runtime (min)" with a linear scale from 0 to 30, marked at intervals of 10.
* **Legend:** Positioned in the top-left corner, identifying two data series:
* `Neuro-symbolic models (AlphaGeometry)`: Represented by a blue line with circular markers.
* `RL-based OST reasoning models`: Represented by a gray line with circular markers.
### Detailed Analysis
**Chart (a): Complex Reasoning Tasks**
* **Tasks & Legend:**
* `TextEdit (C)`: Blue circle
* `ACLUTR (C)`: Orange triangle (pointing up)
* `ProofWriter (C)`: Green triangle (pointing down)
* `TextEdit (M)`: Gray square
* `ACLUTR (M)`: Brown diamond
* `ProofWriter (M)`: Light blue circle
* **Trend & Data Points (Approximate):**
* **General Trend:** Accuracy for all tasks generally increases with model size. The `(C)` variants consistently outperform their `(M)` counterparts.
* `TextEdit (C)`: Starts high (~90% at 7B), approaches ~100% at GPT.
* `ACLUTR (C)`: Starts low (~20% at 7B), shows strong improvement to ~70% at GPT.
* `ProofWriter (C)`: Starts very low (~10% at 7B), improves to ~80% at GPT.
* `TextEdit (M)`: Starts around 50% at 7B, improves to ~90% at GPT.
* `ACLUTR (M)`: Starts around 20% at 7B, improves to ~60% at GPT.
* `ProofWriter (M)`: Starts near 0% at 7B, improves to ~40% at GPT.
**Chart (b): Math Reasoning Tasks**
* **Tasks & Legend:**
* `GSM8K (C)`: Blue circle
* `SVAMP (C)`: Orange triangle (pointing up)
* `TabMWP (C)`: Green triangle (pointing down)
* `In-Domain GSM8K (C)`: Gray square
* `In-Domain MATH (C)`: Brown diamond
* **Trend & Data Points (Approximate):**
* **General Trend:** Accuracy improves with model size, but performance is more varied and generally lower than in complex reasoning tasks. `In-Domain MATH (C)` is the most challenging.
* `GSM8K (C)`: Starts ~55% at 7B, improves to ~95% at GPT.
* `SVAMP (C)`: Starts ~60% at 7B, improves to ~90% at GPT.
* `TabMWP (C)`: Starts ~40% at 7B, improves to ~85% at GPT.
* `In-Domain GSM8K (C)`: Starts ~25% at 7B, improves to ~70% at GPT.
* `In-Domain MATH (C)`: Starts ~10% at 7B, improves to ~50% at GPT.
**Chart (c): Question-Answering Tasks**
* **Tasks & Legend:**
* `AmbigNQ (C)`: Blue circle
* `TriviaQA (C)`: Orange triangle (pointing up)
* `HotpotQA (C)`: Green triangle (pointing down)
* `AmbigNQ (M)`: Gray square
* `TriviaQA (M)`: Brown diamond
* `HotpotQA (M)`: Light blue circle
* **Trend & Data Points (Approximate):**
* **General Trend:** Strong positive correlation between model size and accuracy. `(C)` variants again outperform `(M)` variants.
* `AmbigNQ (C)`: Starts ~65% at 7B, improves to ~95% at GPT.
* `TriviaQA (C)`: Starts ~60% at 7B, improves to ~90% at GPT.
* `HotpotQA (C)`: Starts ~55% at 7B, improves to ~85% at GPT.
* `AmbigNQ (M)`: Starts ~55% at 7B, improves to ~80% at GPT.
* `TriviaQA (M)`: Starts ~40% at 7B, improves to ~75% at GPT.
* `HotpotQA (M)`: Starts ~30% at 7B, improves to ~60% at GPT.
**Chart (d): Scaling Efficiency Analysis**
* **Trend & Data Points (Approximate):**
* **Neuro-symbolic models (AlphaGeometry) - Blue Line:** Shows a steep, near-linear increase in runtime with problem complexity. Starts at ~8 min for `P01_P08`, rises to ~13 min for `P19_P6`.
* **RL-based OST reasoning models - Gray Line:** Shows a more gradual, slightly super-linear increase. Starts at ~12 min for `P01_P08`, rises to ~28 min for `P19_P6`.
* **Key Observation:** The RL-based models have a higher initial runtime but scale worse (steeper slope) than the neuro-symbolic models as problem complexity increases. The lines cross between `P04_P12` and `P12_P15`, after which the neuro-symbolic models become more efficient.
### Key Observations
1. **Consistent Scaling:** Across all task types (Complex Reasoning, Math, QA), increasing model size from 7B to GPT leads to significant accuracy gains.
2. **Task Difficulty Hierarchy:** Within each chart, certain tasks are consistently harder. For example, `ProofWriter (M)` in (a), `In-Domain MATH (C)` in (b), and `HotpotQA (M)` in (c) show the lowest accuracies.
3. **Variant Performance Gap:** The `(C)` variant of each task consistently achieves higher accuracy than the `(M)` variant across all model sizes, suggesting a fundamental difference in difficulty or evaluation setup.
4. **Efficiency Trade-off (Chart d):** There is a clear trade-off between model architecture and scaling efficiency. While RL-based models may have higher base runtime, neuro-symbolic models (AlphaGeometry) demonstrate superior scaling characteristics for this specific reasoning domain, becoming more efficient on more complex problems.
### Interpretation
The data presents a multi-faceted view of AI scaling. Charts (a-c) demonstrate the **"scaling law"** phenomenon: larger models are more capable, as measured by task accuracy. However, the gains are not uniform; they depend heavily on the specific task and its variant. The persistent gap between `(C)` and `(M)` variants suggests that model improvements alone may not close performance gaps on inherently more difficult problem formulations.
Chart (d) shifts the focus from capability (accuracy) to **efficiency (runtime)**. It reveals that scaling behavior is not monolithic. Different architectural paradigms (neuro-symbolic vs. reinforcement learning-based) exhibit fundamentally different computational cost profiles as problem complexity grows. The crossover point indicates that the "best" model depends on the operational context—specifically, the expected complexity of the problems to be solved. For simpler problems, one architecture may be preferable, while for highly complex Olympiad-level reasoning, the other becomes more efficient.
In summary, the image argues that evaluating AI systems requires looking beyond a single metric. True understanding comes from analyzing **capability scaling** (accuracy vs. size) alongside **efficiency scaling** (runtime vs. complexity), and doing so across a diverse set of tasks that probe different facets of intelligence.
DECODING INTELLIGENCE...