## Chart/Diagram Type: Scaling Performance Analysis and Efficiency Analysis
### Overview
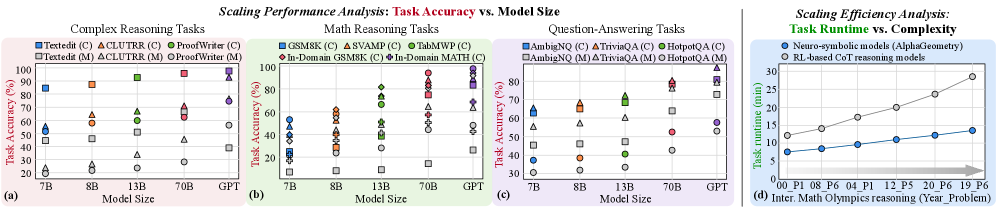
The image contains four graphs and a line chart analyzing the scaling performance of AI models across reasoning tasks and computational efficiency. The left three graphs (a, b, c) compare task accuracy vs. model size for complex reasoning, math reasoning, and question-answering tasks. The right graph (d) compares task runtime vs. complexity for neuro-symbolic and RL-based CoT models.
### Components/Axes
#### Graphs (a), (b), (c): Task Accuracy vs. Model Size
- **X-axis**: Model Size (7B, 8B, 13B, 70B, GPT)
- **Y-axis**: Task Accuracy (%)
- **Legends**:
- **Models**: Textedit, CLUTR, ProofWriter, GSM8K, SVAMP, TabMWP, In-Domain GSM8K, In-Domain MATH, AmbigNQ, TriviaQA, HotpotQA
- **Markers/Colors**:
- Squares (□): Textedit, GSM8K, AmbigNQ
- Triangles (△): CLUTR, SVAMP, TriviaQA
- Circles (●): ProofWriter, TabMWP, HotpotQA
- Colors: Blue, Orange, Green, Red, Purple, Gray
- **Subcategories**:
- (C): Chain-of-Thought (CoT) reasoning
- (M): MCT (Multi-step CoT) reasoning
#### Graph (d): Task Runtime vs. Complexity
- **X-axis**: Problem Complexity (P1, P8, P6, P4, P12, P5, P20, P6, P19, P6)
- **Y-axis**: Task Runtime (minutes)
- **Lines**:
- Blue: Neuro-symbolic models (AlphaGeometry)
- Gray: RL-based CoT reasoning models
### Detailed Analysis
#### Graphs (a), (b), (c): Task Accuracy vs. Model Size
- **Trends**:
- **Complex Reasoning (a)**:
- Textedit(C) (blue square): 50% (7B) → 90% (GPT)
- CLUTR(C) (orange triangle): 60% (7B) → 85% (GPT)
- ProofWriter(C) (green circle): 70% (7B) → 95% (GPT)
- **Math Reasoning (b)**:
- GSM8K(C) (blue square): 40% (7B) → 80% (GPT)
- In-Domain GSM8K(C) (red triangle): 50% (7B) → 85% (GPT)
- **Question-Answering (c)**:
- AmbigNQ(C) (blue square): 30% (7B) → 70% (GPT)
- TriviaQA(C) (orange triangle): 40% (7B) → 80% (GPT)
#### Graph (d): Task Runtime vs. Complexity
- **Trends**:
- Neuro-symbolic models (blue line): Runtime increases linearly from ~5 min (P1) to ~30 min (P19).
- RL-based CoT models (gray line): Runtime increases more steeply, from ~10 min (P1) to ~40 min (P19).
### Key Observations
1. **Model Size vs. Accuracy**:
- Larger models (e.g., GPT) consistently outperform smaller models (7B, 8B) across all tasks.
- CoT models (C) generally achieve higher accuracy than MCT models (M) for the same task.
2. **Runtime vs. Complexity**:
- RL-based CoT models require significantly more time than neuro-symbolic models for complex problems.
- Runtime scales non-linearly with problem complexity for RL-based models.
### Interpretation
- **Scaling Performance**:
- Increasing model size improves task accuracy, particularly for complex reasoning (e.g., GPT achieves 95% accuracy in ProofWriter(C) vs. 70% for 7B models).
- CoT approaches (C) are more effective than MCT (M) but may require larger models to reach peak performance.
- **Efficiency Trade-offs**:
- Neuro-symbolic models (AlphaGeometry) are computationally efficient but less accurate on highly complex tasks.
- RL-based CoT models achieve higher accuracy at the cost of increased runtime, suggesting a trade-off between precision and efficiency.
- **Outliers**:
- In graph (a), ProofWriter(C) (green circle) shows the steepest accuracy improvement with model size, suggesting it is optimized for scaling.
- In graph (d), the divergence between neuro-symbolic and RL-based models widens for problems P12 and P19, indicating RL models struggle more with extreme complexity.
This analysis highlights the importance of model architecture and scaling strategies in balancing accuracy and computational efficiency for AI reasoning systems.