## Line Chart: Reward vs Steps (Mean Min/Max)
### Overview
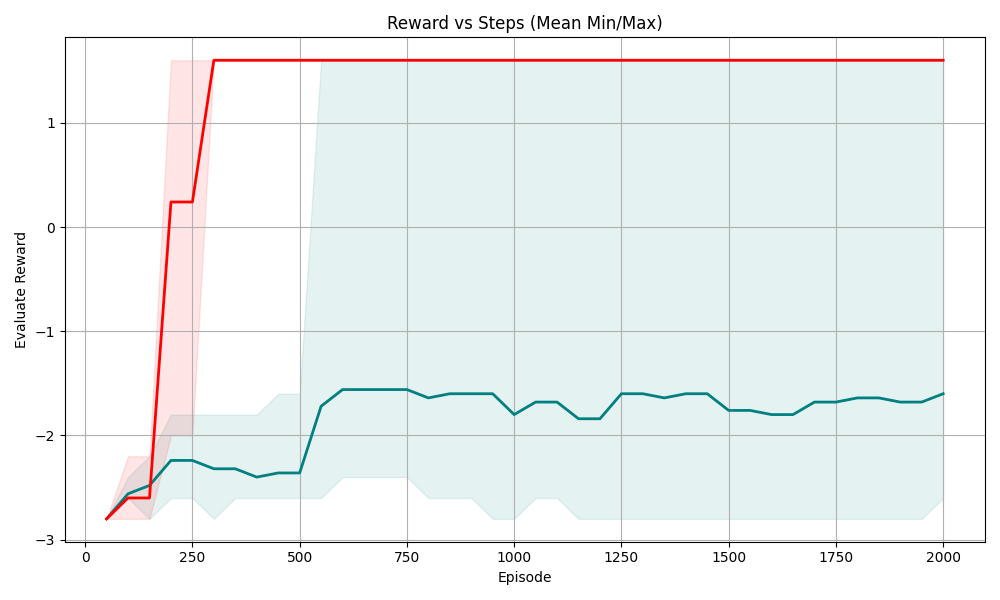
The image is a line chart showing the relationship between "Reward" and "Episode" (steps), displaying the mean, minimum, and maximum reward values over 2000 episodes. There are two primary data series: one representing the "Evaluate Reward" (teal line) and another representing the "Reward" (red line). Shaded regions around each line indicate the min/max range.
### Components/Axes
* **Title:** Reward vs Steps (Mean Min/Max)
* **X-axis:** Episode
* Scale: 0 to 2000, with markers at 0, 250, 500, 750, 1000, 1250, 1500, 1750, and 2000.
* **Y-axis:** Evaluate Reward
* Scale: -3 to 1, with markers at -3, -2, -1, 0, and 1.
* **Data Series:**
* **Reward (Red):** Represents the reward value. The shaded red area around the red line represents the min/max range for the reward.
* **Evaluate Reward (Teal):** Represents the evaluate reward value. The shaded teal area around the teal line represents the min/max range for the evaluate reward.
### Detailed Analysis
* **Reward (Red Line):**
* Trend: The red line starts at approximately -2.75 at episode 0, rapidly increases to approximately 0.25 by episode 150, then jumps to approximately 1.25 by episode 250, and remains constant at approximately 1.25 for the rest of the episodes.
* Data Points:
* Episode 0: -2.75 +/- 0.25
* Episode 150: 0.25 +/- 0.25
* Episode 250 - 2000: 1.25 +/- 0.25
* **Evaluate Reward (Teal Line):**
* Trend: The teal line starts at approximately -2.75 at episode 0, fluctuates slightly until episode 500, then increases to approximately -1.5, and remains relatively stable around -1.5 for the rest of the episodes.
* Data Points:
* Episode 0: -2.75 +/- 0.25
* Episode 500: -2.5 +/- 0.25
* Episode 750 - 2000: -1.5 +/- 0.25
* **Min/Max Shaded Regions:**
* The red shaded region shows the variability in the "Reward" values, which is higher in the initial episodes and becomes negligible after the reward stabilizes.
* The teal shaded region shows the variability in the "Evaluate Reward" values, which remains relatively consistent throughout the episodes.
### Key Observations
* The "Reward" increases rapidly in the initial episodes and then plateaus at a high value.
* The "Evaluate Reward" increases gradually and stabilizes at a lower value compared to the "Reward".
* The variability in "Reward" decreases significantly as the episodes progress, while the variability in "Evaluate Reward" remains relatively constant.
### Interpretation
The chart suggests that the agent quickly learns to maximize the reward, as indicated by the rapid increase and subsequent plateau of the "Reward" line. The "Evaluate Reward" line, which likely represents the performance of the agent on a separate evaluation set, shows a more gradual improvement and stabilizes at a lower level. This could indicate that the agent is overfitting to the training environment or that the evaluation environment is more challenging. The shaded regions provide insights into the consistency of the rewards, with the "Reward" becoming more consistent over time while the "Evaluate Reward" remains relatively variable.