## Line Chart: Reward vs Steps (Mean Min/Max)
### Overview
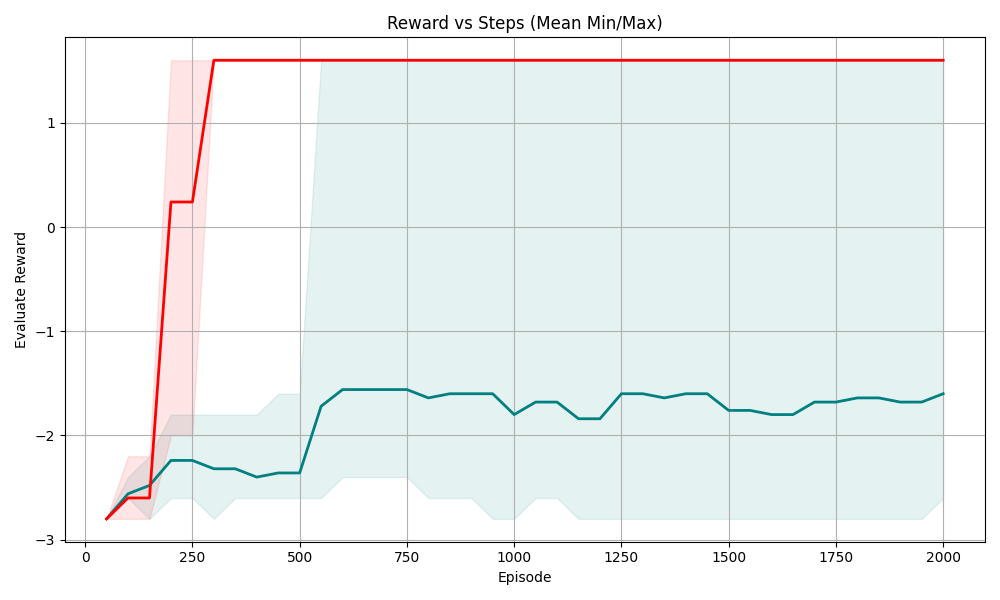
The chart compares two reward metrics ("Mean Reward" and "Min/Max Reward") across 2000 episodes. The x-axis represents episodes (0–2000), and the y-axis represents "Evaluate Reward" values ranging from -3 to 1. Two lines with shaded confidence intervals are plotted: a red line for "Mean Reward" and a teal line for "Min/Max Reward."
### Components/Axes
- **X-axis (Episode)**: Labeled "Episode," with ticks at 0, 250, 500, 750, 1000, 1250, 1500, 1750, and 2000.
- **Y-axis (Evaluate Reward)**: Labeled "Evaluate Reward," with ticks at -3, -2, -1, 0, and 1.
- **Legend**: Located at the top-right corner, with:
- **Red**: "Mean Reward"
- **Teal**: "Min/Max Reward"
- **Shaded Areas**: Light red (Mean Reward) and light teal (Min/Max Reward) bands around the lines, indicating variability.
### Detailed Analysis
1. **Mean Reward (Red Line)**:
- Starts at **-3** at episode 0.
- Sharp upward spike to **0.25** by episode 100.
- Plateaus at **1.25** from episode 100 to 2000.
- Shaded area narrows significantly after episode 100, suggesting reduced variability.
2. **Min/Max Reward (Teal Line)**:
- Starts at **-3** at episode 0.
- Gradual upward trend, fluctuating between **-2.5** and **-1.5** until episode 500.
- Peaks at **-1.25** around episode 500, then stabilizes between **-1.8** and **-1.2** for the remaining episodes.
- Shaded area remains broader than the red line, indicating higher variability.
### Key Observations
- The **Mean Reward** stabilizes at a high value (1.25) after episode 100, while the **Min/Max Reward** shows slower improvement.
- The **Min/Max Reward** exhibits persistent variability (shaded area width) compared to the Mean Reward.
- Both lines originate at -3 but diverge sharply after episode 100.
### Interpretation
- The **Mean Reward** demonstrates rapid convergence to a stable, high reward value, suggesting effective learning or optimization after episode 100.
- The **Min/Max Reward** indicates that while the worst-case performance improves over time, it remains more variable than the mean, highlighting potential instability in extreme outcomes.
- The divergence between the two lines after episode 100 suggests that while average performance is strong, there are still significant fluctuations in individual episode rewards, possibly due to environmental noise or exploration strategies.