## Line Charts: Performance Comparison Across Datasets
### Overview
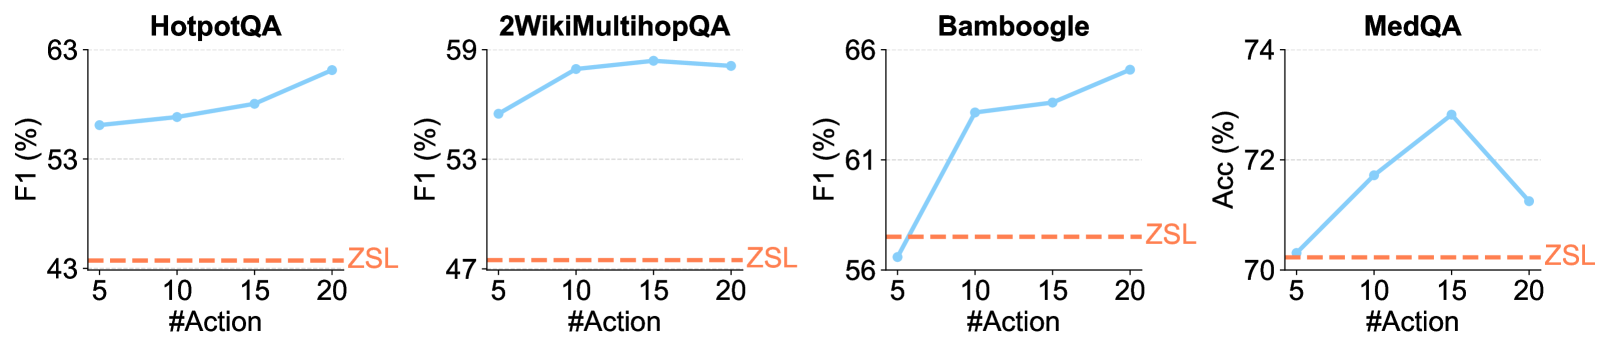
The image contains four line charts, each displaying the performance of a model on a different question-answering dataset. The x-axis represents the number of actions, and the y-axis represents the F1 score (for HotpotQA, 2WikiMultihopQA, and Bamboogle) or Accuracy (for MedQA). A horizontal dashed line indicates the Zero-Shot Learning (ZSL) baseline performance for each dataset.
### Components/Axes
* **Titles (Top of each chart):**
* HotpotQA
* 2WikiMultihopQA
* Bamboogle
* MedQA
* **X-Axis:**
* Label: "#Action"
* Values: 5, 10, 15, 20
* **Y-Axis:**
* Label (Charts 1-3): "F1 (%)"
* Scale: Varies for each chart.
* HotpotQA: 43 to 63
* 2WikiMultihopQA: 47 to 59
* Bamboogle: 56 to 66
* Label (Chart 4): "Acc (%)"
* Scale: 70 to 74
* **Data Series:**
* Blue Line: Model Performance
* Orange Dashed Line: ZSL (Zero-Shot Learning) Baseline
* **Legend:** The label "ZSL" is placed near the right end of each orange dashed line.
### Detailed Analysis
**1. HotpotQA**
* Y-Axis Range: 53 to 63
* Blue Line Trend: Upward sloping
* (#Action = 5): F1 ≈ 57%
* (#Action = 10): F1 ≈ 58%
* (#Action = 15): F1 ≈ 60%
* (#Action = 20): F1 ≈ 62.5%
* ZSL Baseline: F1 ≈ 43% (horizontal dashed orange line)
**2. 2WikiMultihopQA**
* Y-Axis Range: 53 to 59
* Blue Line Trend: Increases then plateaus
* (#Action = 5): F1 ≈ 55%
* (#Action = 10): F1 ≈ 58%
* (#Action = 15): F1 ≈ 58.8%
* (#Action = 20): F1 ≈ 58.5%
* ZSL Baseline: F1 ≈ 47% (horizontal dashed orange line)
**3. Bamboogle**
* Y-Axis Range: 61 to 66
* Blue Line Trend: Upward sloping
* (#Action = 5): F1 ≈ 56.2%
* (#Action = 10): F1 ≈ 63%
* (#Action = 15): F1 ≈ 64%
* (#Action = 20): F1 ≈ 65%
* ZSL Baseline: F1 ≈ 56.5% (horizontal dashed orange line)
**4. MedQA**
* Y-Axis Range: 70 to 74
* Blue Line Trend: Increases then decreases (peak at #Action = 10)
* (#Action = 5): Accuracy ≈ 71%
* (#Action = 10): Accuracy ≈ 73%
* (#Action = 15): Accuracy ≈ 72%
* (#Action = 20): Accuracy ≈ 71%
* ZSL Baseline: Accuracy ≈ 70.2% (horizontal dashed orange line)
### Key Observations
* The model's performance (blue line) generally improves with an increasing number of actions for HotpotQA and Bamboogle.
* For 2WikiMultihopQA, the performance plateaus after 10 actions.
* For MedQA, the performance peaks at 10 actions and then declines.
* In all datasets, the model's performance is better than the ZSL baseline.
### Interpretation
The charts demonstrate the impact of the number of actions on the model's performance across different question-answering datasets. The upward trends in HotpotQA and Bamboogle suggest that increasing the number of actions can lead to better performance on these datasets. However, the plateau in 2WikiMultihopQA and the peak-and-decline pattern in MedQA indicate that there may be a point of diminishing returns or even a negative impact from increasing the number of actions beyond a certain threshold for these datasets. The fact that the model consistently outperforms the ZSL baseline suggests that the model is learning and generalizing effectively. The MedQA dataset shows a unique trend, suggesting that too many actions may lead to overfitting or confusion.