\n
## Line Charts: Performance Metrics Across Four QA Datasets
### Overview
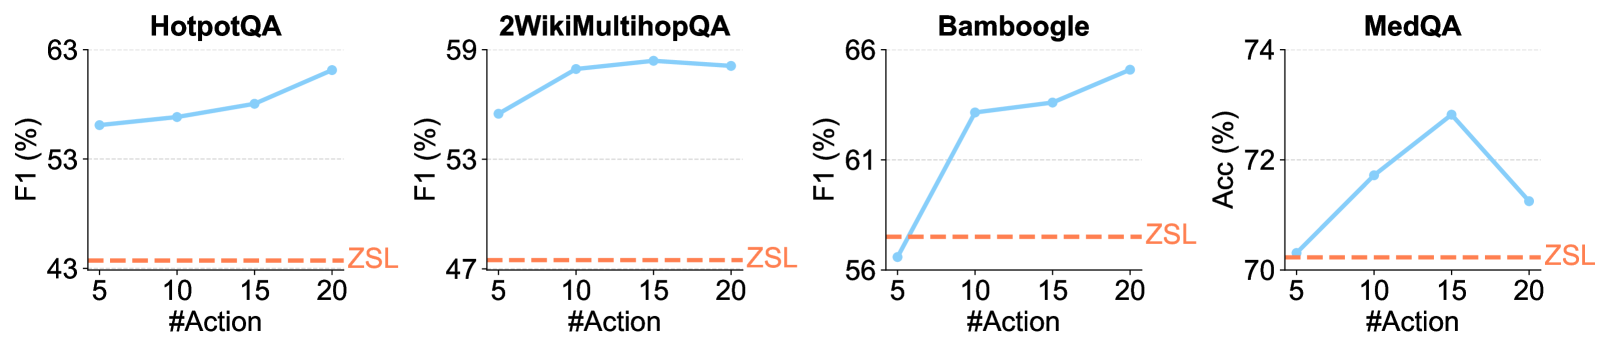
The image displays four separate line charts arranged horizontally, each comparing the performance of a system (blue line) against a Zero-Shot Learning (ZSL) baseline (orange dashed line) across different numbers of actions (#Action). The charts measure performance using either F1 score or Accuracy percentage.
### Components/Axes
* **Chart Titles (Top Center):** HotpotQA, 2WikiMultihopQA, Bamboogle, MedQA.
* **X-Axis (Bottom, All Charts):** Label: `#Action`. Ticks: 5, 10, 15, 20.
* **Y-Axis (Left):**
* Charts 1-3 (HotpotQA, 2WikiMultihopQA, Bamboogle): Label: `F1 (%)`. Scale varies per chart.
* Chart 4 (MedQA): Label: `Acc (%)`.
* **Legend (Bottom Right of each chart):** A dashed orange line labeled `ZSL`.
* **Data Series:**
* **Blue Line with Circular Markers:** Represents the primary system's performance.
* **Orange Dashed Line:** Represents the constant ZSL baseline performance.
### Detailed Analysis
**1. HotpotQA (Leftmost Chart)**
* **Y-Axis Range:** Approximately 43% to 63%.
* **ZSL Baseline (Orange Dashed):** Constant at ~43%.
* **System Performance (Blue Line):** Shows a steady, monotonic upward trend.
* #Action=5: ~55%
* #Action=10: ~56%
* #Action=15: ~58%
* #Action=20: ~62%
**2. 2WikiMultihopQA (Second Chart)**
* **Y-Axis Range:** Approximately 47% to 59%.
* **ZSL Baseline (Orange Dashed):** Constant at ~47%.
* **System Performance (Blue Line):** Increases sharply initially, then plateaus.
* #Action=5: ~55%
* #Action=10: ~58%
* #Action=15: ~59% (Peak)
* #Action=20: ~58.5% (Slight decrease)
**3. Bamboogle (Third Chart)**
* **Y-Axis Range:** Approximately 56% to 66%.
* **ZSL Baseline (Orange Dashed):** Constant at ~58%.
* **System Performance (Blue Line):** Shows a steep initial increase followed by a more gradual rise.
* #Action=5: ~56.5% (Below ZSL)
* #Action=10: ~63%
* #Action=15: ~63.5%
* #Action=20: ~65%
**4. MedQA (Rightmost Chart)**
* **Y-Axis Range:** Approximately 70% to 74%.
* **ZSL Baseline (Orange Dashed):** Constant at ~70%.
* **System Performance (Blue Line):** Shows an inverted-V trend, peaking at #Action=15.
* #Action=5: ~70.2% (Near ZSL)
* #Action=10: ~71.8%
* #Action=15: ~73% (Peak)
* #Action=20: ~71.2% (Decrease)
### Key Observations
1. **Consistent Outperformance:** The system (blue line) outperforms the ZSL baseline (orange line) in all charts for #Action ≥ 10. At #Action=5, it is below or near the baseline in Bamboogle and MedQA.
2. **Performance Trend:** Three charts (HotpotQA, 2WikiMultihopQA, Bamboogle) show a generally positive correlation between #Action and F1 score, though with diminishing returns or slight dips at the highest action count in two cases.
3. **MedQA Anomaly:** The MedQA chart is unique, using Accuracy instead of F1 and showing a clear performance peak at #Action=15 followed by a decline, suggesting an optimal action count for this specific task.
4. **Baseline Consistency:** The ZSL performance is flat across all action counts within each task, serving as a fixed reference point.
### Interpretation
The data suggests that increasing the number of actions (#Action) generally improves the system's performance on multi-hop and complex question-answering tasks (HotpotQA, 2WikiMultihopQA, Bamboogle) compared to a zero-shot approach. The improvement is most dramatic between 5 and 10 actions.
The MedQA result is particularly insightful. It indicates that for this medical QA task, there is a "sweet spot" (around 15 actions) for system performance. Exceeding this may introduce noise, complexity, or error propagation that degrades accuracy. This contrasts with the other tasks where more actions (up to 20) continue to yield benefits, albeit sometimes marginal.
Overall, the charts demonstrate the value of action-based reasoning over zero-shot methods for these benchmarks, while also highlighting that the optimal strategy can be task-dependent. The system shows robust gains, but the relationship between computational effort (#Action) and performance is not universally linear.