## Line Chart: Error Rates Over Epochs
### Overview
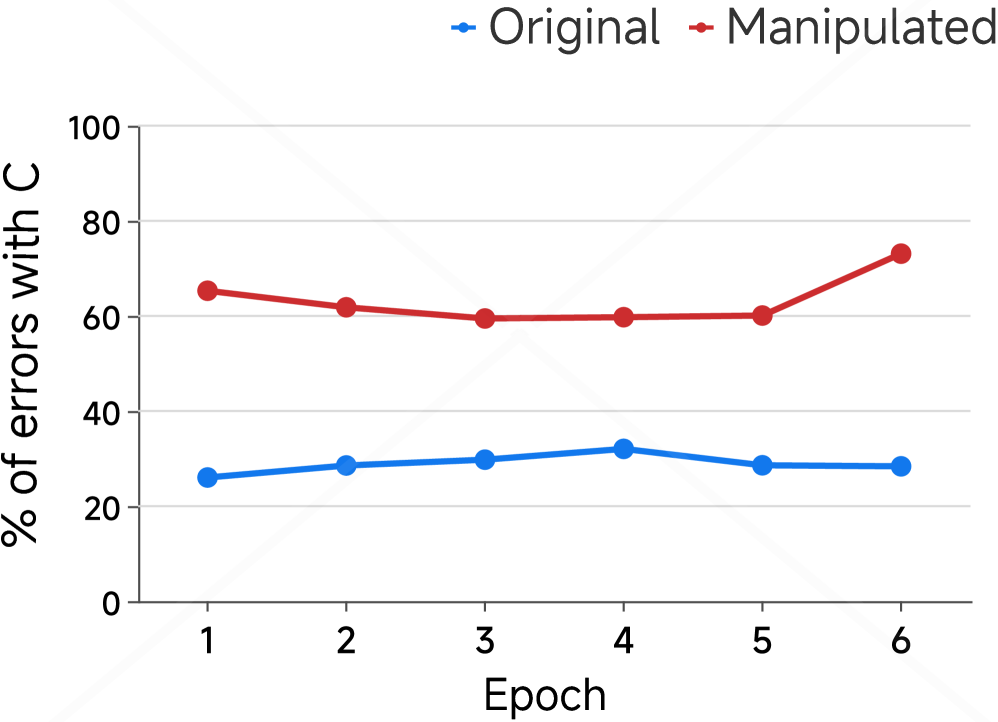
The image is a line chart comparing the percentage of errors with 'C' over six epochs for two conditions: "Original" and "Manipulated". The x-axis represents the epoch number, and the y-axis represents the percentage of errors.
### Components/Axes
* **Title:** Implicitly, the chart compares error rates between original and manipulated data.
* **X-axis:** "Epoch" with values 1 to 6.
* **Y-axis:** "% of errors with C" ranging from 0 to 100, with tick marks at 20, 40, 60, 80, and 100.
* **Legend:** Located at the top-right of the chart.
* Blue line with circle markers: "Original"
* Red line with circle markers: "Manipulated"
### Detailed Analysis
* **Original (Blue):** The error rate starts at approximately 27% at epoch 1, increases to about 30% at epoch 2, remains around 30% at epoch 3, peaks at approximately 33% at epoch 4, then decreases to about 29% at epoch 5 and remains at approximately 29% at epoch 6.
* Epoch 1: ~27%
* Epoch 2: ~30%
* Epoch 3: ~30%
* Epoch 4: ~33%
* Epoch 5: ~29%
* Epoch 6: ~29%
* **Manipulated (Red):** The error rate starts at approximately 66% at epoch 1, decreases to about 62% at epoch 2, decreases further to about 60% at epoch 3, remains around 60% at epoch 4, remains around 60% at epoch 5, then increases to approximately 73% at epoch 6.
* Epoch 1: ~66%
* Epoch 2: ~62%
* Epoch 3: ~60%
* Epoch 4: ~60%
* Epoch 5: ~60%
* Epoch 6: ~73%
### Key Observations
* The "Manipulated" condition consistently has a higher percentage of errors compared to the "Original" condition across all epochs.
* The "Original" condition shows a slight increase in error rate initially, followed by a decrease and then stabilization.
* The "Manipulated" condition shows a decreasing trend in error rate for the first three epochs, then stabilizes, and finally increases significantly in the last epoch.
### Interpretation
The data suggests that the manipulation has a significant impact on the error rate. Initially, the manipulation might be causing more errors, but as the epochs progress, the system might be adapting to the manipulation, leading to a slight decrease in errors. However, the final increase in errors at epoch 6 for the "Manipulated" condition could indicate a limit to the system's adaptability or a change in the nature of the manipulation. The "Original" condition shows a relatively stable error rate, indicating a consistent performance baseline. The difference between the two lines shows the impact of the manipulation on the error rate.