\n
## Line Chart: Percentage of Errors with C vs. Epoch
### Overview
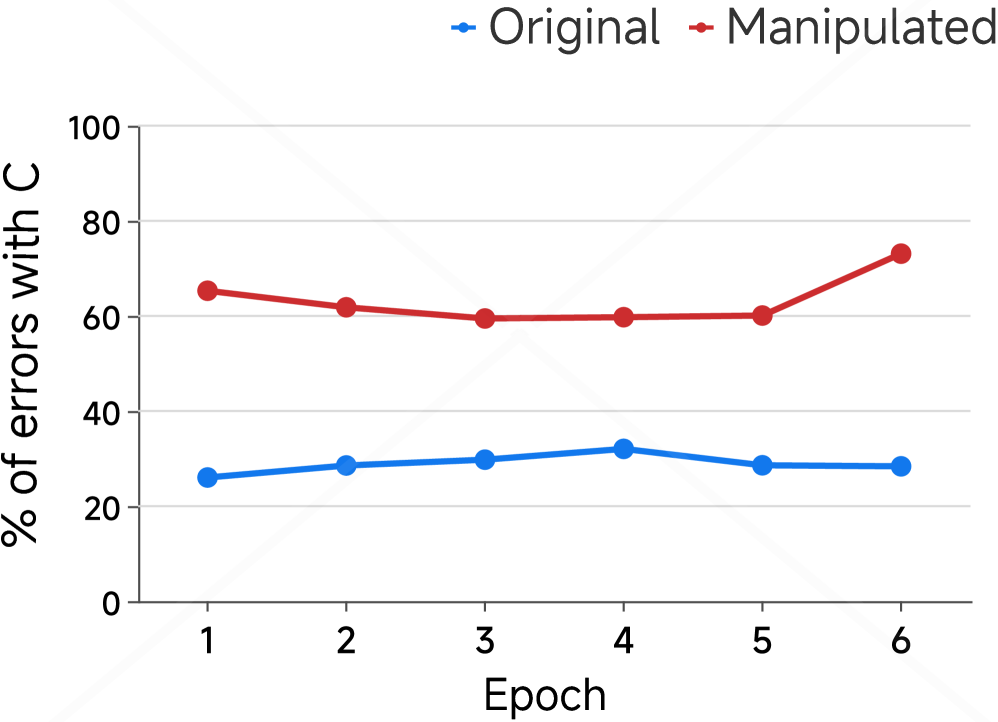
This image presents a line chart comparing the percentage of errors with 'C' over different epochs for both original and manipulated data. The chart visualizes how the error rate changes as the training process (epochs) progresses.
### Components/Axes
* **X-axis:** "Epoch" - ranging from 1 to 6.
* **Y-axis:** "% of errors with C" - ranging from 0 to 100.
* **Data Series:**
* "Original" - represented by a blue line with circular markers.
* "Manipulated" - represented by a red line with circular markers.
* **Legend:** Located at the top-center of the chart, clearly labeling each line with its corresponding data series.
### Detailed Analysis
The chart displays two distinct lines representing the error rates for the original and manipulated datasets across six epochs.
**Original Data (Blue Line):**
The blue line shows a relatively stable error rate.
* Epoch 1: Approximately 28%
* Epoch 2: Approximately 26%
* Epoch 3: Approximately 30%
* Epoch 4: Approximately 32%
* Epoch 5: Approximately 28%
* Epoch 6: Approximately 28%
The line fluctuates slightly, but remains within a narrow range between 26% and 32%.
**Manipulated Data (Red Line):**
The red line shows a generally decreasing trend initially, followed by an increase.
* Epoch 1: Approximately 64%
* Epoch 2: Approximately 61%
* Epoch 3: Approximately 60%
* Epoch 4: Approximately 60%
* Epoch 5: Approximately 64%
* Epoch 6: Approximately 74%
The line starts at around 64%, dips slightly to 60%, and then rises to 74% in the final epoch.
### Key Observations
* The manipulated data consistently exhibits a higher error rate than the original data across all epochs.
* The error rate for the original data remains relatively stable throughout the epochs.
* The error rate for the manipulated data decreases slightly in the first few epochs, but then increases significantly in the later epochs.
* The gap between the error rates of the original and manipulated data widens in the later epochs.
### Interpretation
The data suggests that the manipulation of the dataset has a significant impact on the error rate during training. While the original data maintains a consistent and relatively low error rate, the manipulated data shows a higher error rate that increases over time. This could indicate that the manipulation introduces inconsistencies or biases that hinder the learning process. The initial decrease in error rate for the manipulated data might be due to the model adapting to the changes, but the subsequent increase suggests that the manipulation ultimately leads to a degradation in performance. The widening gap between the two lines highlights the detrimental effect of the manipulation on the model's ability to generalize. This could be due to overfitting to the manipulated data or the introduction of conflicting information. Further investigation is needed to understand the nature of the manipulation and its specific impact on the model's learning process.