## Bar Chart: Execution Time and Particle Count Comparison Across Scenarios
### Overview
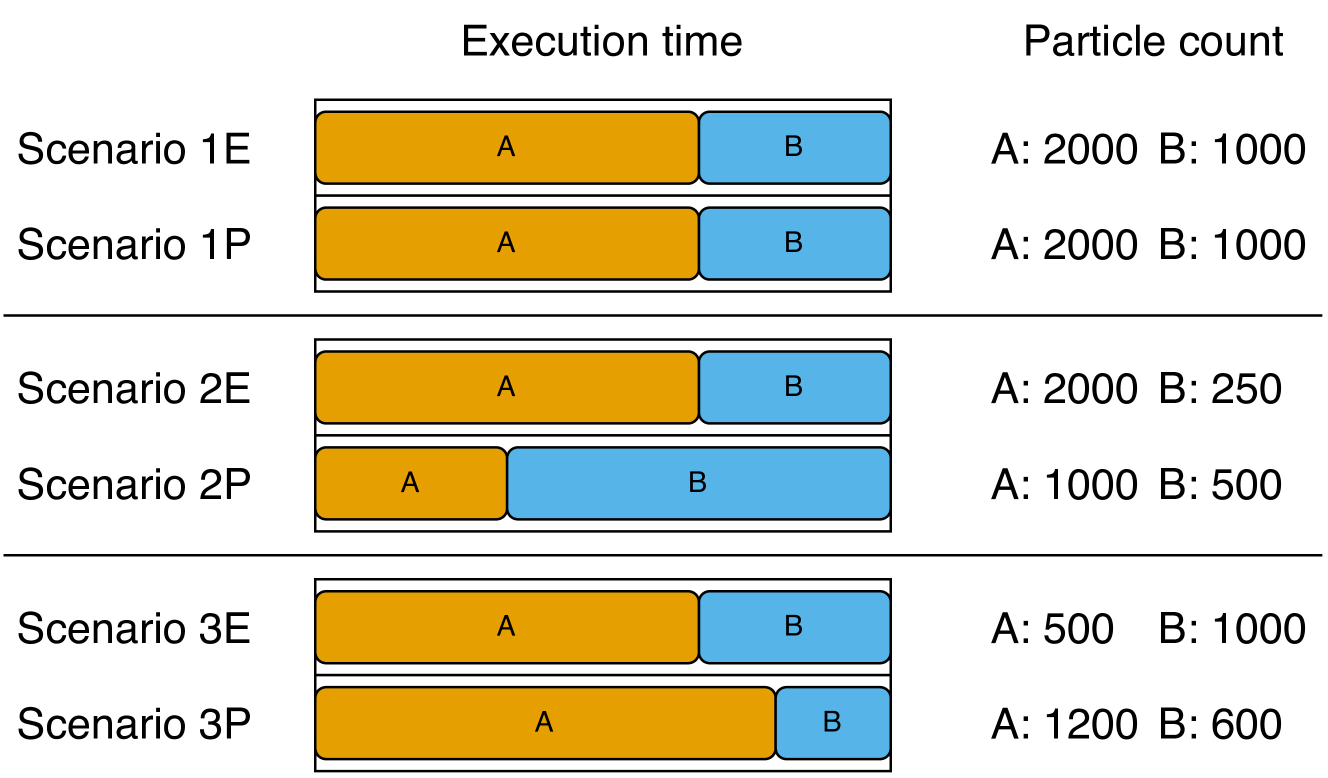
The chart compares execution times (represented by bar lengths) and particle counts (numerical values) for two components (A and B) across three scenarios (1, 2, 3), each with two sub-scenarios (E and P). Component A is consistently represented by orange bars, while B uses blue bars. Execution time is plotted on the x-axis, and scenarios/sub-scenarios are labeled on the y-axis.
---
### Components/Axes
- **X-axis**: "Execution time" (no numerical scale provided; bar lengths imply relative values).
- **Y-axis**: Scenarios (1, 2, 3) with sub-scenarios (E, P) listed vertically.
- **Legend**:
- Orange = Component A
- Blue = Component B
- **Particle Count Labels**: Numerical values for A and B are listed to the right of each scenario/sub-scenario pair.
---
### Detailed Analysis
#### Scenario 1
- **1E**:
- A: Execution time (long orange bar), Particle count = 2000
- B: Execution time (short blue bar), Particle count = 1000
- **1P**:
- A: Execution time (long orange bar), Particle count = 2000
- B: Execution time (short blue bar), Particle count = 1000
#### Scenario 2
- **2E**:
- A: Execution time (long orange bar), Particle count = 2000
- B: Execution time (short blue bar), Particle count = 250
- **2P**:
- A: Execution time (short orange bar), Particle count = 1000
- B: Execution time (long blue bar), Particle count = 500
#### Scenario 3
- **3E**:
- A: Execution time (long orange bar), Particle count = 500
- B: Execution time (short blue bar), Particle count = 1000
- **3P**:
- A: Execution time (very long orange bar), Particle count = 1200
- B: Execution time (short blue bar), Particle count = 600
---
### Key Observations
1. **Consistency in Scenario 1**: Both sub-scenarios (E/P) show identical particle counts (A: 2000, B: 1000) and execution time patterns (A > B).
2. **Scenario 2 Anomaly**:
- In 2P, B’s execution time exceeds A’s despite having half the particle count (500 vs. 1000).
3. **Scenario 3 Efficiency Shift**:
- 3E: B has double A’s particle count (1000 vs. 500) but shorter execution time.
- 3P: A’s execution time is longest despite only 1200 particles (vs. B’s 600).
---
### Interpretation
- **Component A** generally requires longer execution time but handles higher particle loads in most scenarios (e.g., 1E, 2E, 3P). However, in 2P, B’s execution time surpasses A’s despite lower particle counts, suggesting inefficiency or resource contention.
- **Component B** shows variable performance:
- In 2E, it processes fewer particles (250) but with minimal execution time.
- In 3E, it handles more particles (1000) than A (500) but with shorter execution time, indicating higher efficiency in this sub-scenario.
- **Scenario 3P** highlights a trade-off: A processes twice as many particles as B but takes significantly longer, potentially indicating scalability limitations.
The data suggests that component selection depends on the scenario’s requirements. For high-particle tasks (e.g., 1E, 3P), A is preferable despite longer execution. For scenarios prioritizing speed over particle count (e.g., 2E, 3E), B may be more efficient.