## Heatmap: Attention and MLP Component Importance
### Overview
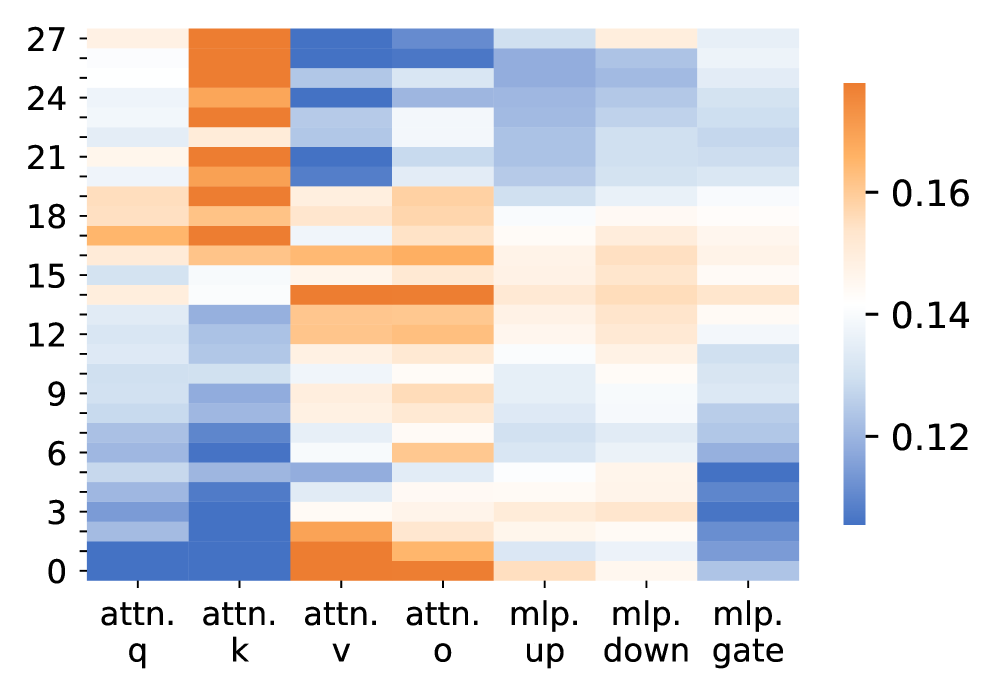
The image is a heatmap visualizing the importance or contribution of different components in an attention mechanism and MLP (multi-layer perceptron) across 28 rows (labeled 0–27). The color gradient ranges from blue (low values, ~0.12) to orange (high values, ~0.16), with intermediate shades of white and light blue.
### Components/Axes
- **X-axis (Horizontal)**:
- Labels: `attn. q`, `attn. k`, `attn. v`, `attn. o`, `mlp. up`, `mlp. down`, `mlp. gate`.
- Categories: Attention mechanism components (`q`, `k`, `v`, `o`) and MLP components (`up`, `down`, `gate`).
- **Y-axis (Vertical)**:
- Labels: Numerical indices from 0 to 27 (no explicit labels beyond the axis title).
- **Legend**:
- Positioned on the right, with a gradient from blue (0.12) to orange (0.16). No explicit title or units provided.
### Detailed Analysis
- **Attention Components**:
- `attn. q` and `attn. k`: Predominantly dark blue (low values, ~0.12–0.13) across most rows.
- `attn. v`: Higher values (orange, ~0.15–0.16) in rows 0–15, with lighter shades in rows 18–27.
- `attn. o`: Mixed values; orange in rows 0–15, transitioning to white/light blue in rows 18–27.
- **MLP Components**:
- `mlp. up` and `mlp. down`: Mostly light blue/white (~0.13–0.14) across all rows.
- `mlp. gate`: Darker blue (~0.12–0.13) in rows 0–15, with lighter shades in rows 18–27.
- **Row Trends**:
- Rows 0–15 show higher variability in attention components (e.g., `attn. v` and `attn. o` are more prominent).
- Rows 18–27 exhibit more uniform, lower values across all components, with `mlp. gate` consistently darker.
### Key Observations
1. **Attention Dominance**: `attn. v` and `attn. o` consistently show higher values than `attn. q` and `attn. k`, suggesting greater importance in these components.
2. **MLP Gate Variability**: `mlp. gate` has the lowest values overall, with a slight increase in rows 0–15.
3. **Row-Specific Patterns**: Rows 0–15 display more pronounced differences between components, while rows 18–27 are more homogeneous.
### Interpretation
The heatmap highlights the relative importance of attention and MLP components in a neural network. The higher values for `attn. v` and `attn. o` suggest these components play a more critical role in the model's behavior compared to `attn. q` and `attn. k`. The MLP gate (`mlp. gate`) appears less influential, with consistently low values. The row-wise variation (0–27) may indicate differences across layers, data samples, or training iterations, though no clear pattern is evident without additional context. The color gradient confirms that values are normalized, with orange representing the upper bound (~0.16) and blue the lower (~0.12).