## Heatmap: Layer Attribution
### Overview
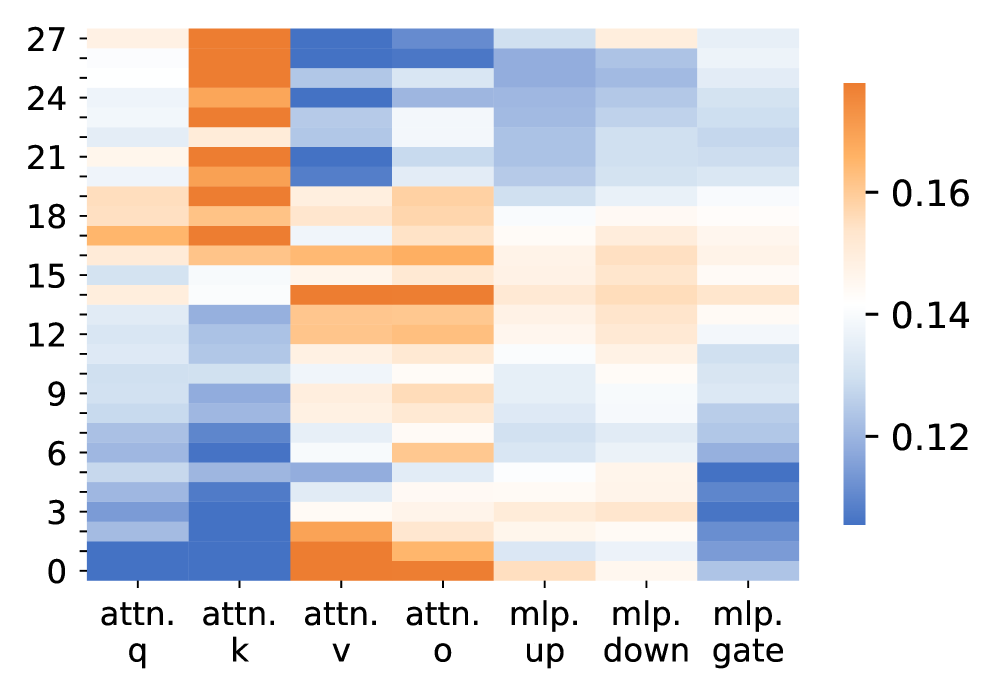
The image is a heatmap visualizing layer attribution across different components of a neural network. The heatmap displays the relative importance or contribution of each layer (y-axis, ranging from 0 to 27) to different parts of the model (x-axis: attn.q, attn.k, attn.v, attn.o, mlp.up, mlp.down, mlp.gate). The color intensity represents the magnitude of attribution, with orange indicating higher values (around 0.16) and blue indicating lower values (around 0.12).
### Components/Axes
* **Y-axis (Layers):** Numerical labels from 0 to 27, incrementing by 3.
* **X-axis (Model Components):** Categorical labels: attn.q, attn.k, attn.v, attn.o, mlp.up, mlp.down, mlp.gate.
* **Color Scale (Attribution):** A color bar on the right side of the heatmap indicates the attribution values. Orange represents higher attribution (approximately 0.16), white represents intermediate values (approximately 0.14), and blue represents lower attribution (approximately 0.12).
### Detailed Analysis
The heatmap displays the attribution scores for each layer (0-27) across the different model components.
* **attn.q:** Lower layers (0-6) show lower attribution (blue), while higher layers (18-27) show moderate attribution (white/light orange).
* **attn.k:** Similar to attn.q, lower layers (0-6) show lower attribution (blue), while higher layers (18-27) show moderate attribution (white/light orange).
* **attn.v:** Shows high attribution (orange) for most layers, especially layers 0-24.
* **attn.o:** Shows high attribution (orange) for layers 0-6 and 12-15, with lower attribution (blue) for layers 24-27.
* **mlp.up:** Shows low attribution (blue) for lower layers (0-6), and moderate attribution (white/light orange) for higher layers (18-27).
* **mlp.down:** Shows low attribution (blue) for most layers, with slightly higher attribution (white) for layers 12-18.
* **mlp.gate:** Shows low attribution (blue) for lower layers (0-6), and moderate attribution (white/light orange) for higher layers (18-27).
### Key Observations
* The 'attn.v' component exhibits the highest attribution across most layers.
* The 'attn.q' and 'attn.k' components show a similar pattern of lower attribution in lower layers and moderate attribution in higher layers.
* The 'mlp.down' component generally has the lowest attribution across all layers.
* The lower layers (0-6) generally have lower attribution for 'attn.q', 'attn.k', 'mlp.up', and 'mlp.gate' components.
### Interpretation
The heatmap visualizes the contribution of each layer to different parts of the model. The high attribution of 'attn.v' suggests that this component is crucial for the model's performance. The lower attribution of 'mlp.down' might indicate that this component plays a less significant role. The varying attribution patterns across layers and components provide insights into the model's internal workings and can be used for model optimization or understanding its behavior. The data suggests that the attention value component ('attn.v') is the most important, while the MLP down-projection ('mlp.down') is the least important. The attention query and key ('attn.q' and 'attn.k') and MLP up-projection and gate ('mlp.up' and 'mlp.gate') have similar attribution patterns, suggesting they may be related in the model's architecture.