## Chart: Algorithm Performance vs. Alpha
### Overview
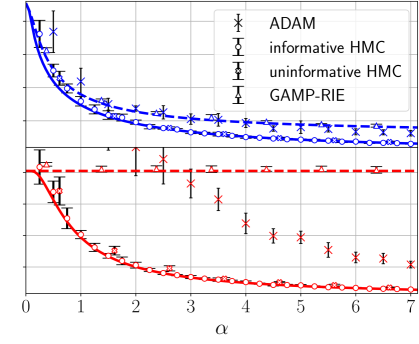
The image is a chart comparing the performance of four algorithms (ADAM, informative HMC, uninformative HMC, and GAMP-RIE) across varying values of a parameter denoted as alpha (α). The chart displays the performance of each algorithm as a function of alpha, with error bars indicating the uncertainty in the measurements.
### Components/Axes
* **X-axis:** α (alpha), ranging from 0 to 7, with tick marks at every integer value.
* **Y-axis:** The Y-axis is not explicitly labeled, but it represents a performance metric. The values on the Y-axis are not explicitly marked, but the data ranges approximately from 0 to 1.
* **Legend (Top-Right):**
* `* ADAM`: Represented by blue asterisks connected by a solid blue line.
* `o informative HMC`: Represented by blue circles connected by a solid blue line.
* `o uninformative HMC`: Represented by red circles connected by a solid red line.
* `△ GAMP-RIE`: Represented by red triangles connected by a dashed red line.
### Detailed Analysis
* **ADAM (Blue Asterisks, Solid Line):** The performance of ADAM starts high and decreases rapidly as alpha increases from 0 to 1. It then continues to decrease more gradually as alpha increases further, approaching a relatively stable value.
* α = 0: Performance ≈ 0.9
* α = 1: Performance ≈ 0.4
* α = 7: Performance ≈ 0.2
* **Informative HMC (Blue Circles, Solid Line):** The performance of informative HMC mirrors that of ADAM, starting high and decreasing rapidly as alpha increases from 0 to 1. It then continues to decrease more gradually as alpha increases further, approaching a relatively stable value.
* α = 0: Performance ≈ 0.85
* α = 1: Performance ≈ 0.35
* α = 7: Performance ≈ 0.15
* **Uninformative HMC (Red Circles, Solid Line):** The performance of uninformative HMC starts high and decreases rapidly as alpha increases from 0 to 1. It then continues to decrease more gradually as alpha increases further, approaching a relatively stable value.
* α = 0: Performance ≈ 0.7
* α = 1: Performance ≈ 0.15
* α = 7: Performance ≈ 0.02
* **GAMP-RIE (Red Triangles, Dashed Line):** The performance of GAMP-RIE remains relatively constant across all values of alpha.
* α = 0: Performance ≈ 0.7
* α = 7: Performance ≈ 0.7
### Key Observations
* ADAM and informative HMC exhibit similar performance trends, with a rapid decrease in performance as alpha increases from 0 to 1, followed by a more gradual decrease.
* Uninformative HMC shows a similar trend to ADAM and informative HMC, but with a more pronounced initial drop in performance.
* GAMP-RIE maintains a relatively constant performance level across all values of alpha.
* The error bars suggest that the uncertainty in the performance measurements is relatively small for most data points.
### Interpretation
The chart suggests that the performance of ADAM, informative HMC, and uninformative HMC is sensitive to the value of alpha, with higher values of alpha generally leading to lower performance. In contrast, the performance of GAMP-RIE appears to be relatively insensitive to alpha. This could indicate that GAMP-RIE is more robust to changes in this parameter or that it is optimized for a different range of alpha values. The rapid initial drop in performance for the HMC methods suggests that there may be a critical value of alpha beyond which their performance degrades significantly. The error bars provide an indication of the reliability of the performance measurements, with smaller error bars indicating greater confidence in the results.