## Line Plot with Error Bars: Performance Metrics vs. Parameter α
### Overview
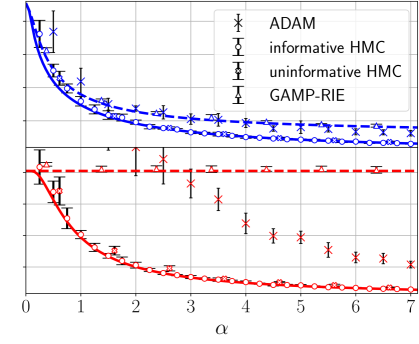
The image is a technical line plot comparing the performance of four different algorithms or methods (ADAM, informative HMC, uninformative HMC, GAMP-RIE) as a function of a parameter labeled α. The plot displays two distinct groups of data series, colored blue and red, each with associated error bars. The general trend for all series is a decrease in the y-axis value as α increases, with the blue series starting at a higher value and the red series starting at a lower value.
### Components/Axes
* **X-Axis:**
* **Label:** `α` (Greek letter alpha).
* **Scale:** Linear scale from 0 to 7.
* **Major Tick Marks:** At integer values 0, 1, 2, 3, 4, 5, 6, 7.
* **Y-Axis:**
* **Label:** Not explicitly labeled in the visible portion of the image. The axis represents a quantitative metric (likely error, loss, or a similar performance measure where lower is better).
* **Scale:** Linear scale. The visible range is from 0 to an unmarked upper limit, estimated to be around 1.0 based on the starting points of the blue lines.
* **Major Tick Marks:** Not numerically labeled, but grid lines are present.
* **Legend:**
* **Position:** Top-right corner of the plot area.
* **Content:** Lists four data series with corresponding markers:
1. `ADAM` - Blue line with circle markers (`o`).
2. `informative HMC` - Blue line with plus sign markers (`+`).
3. `uninformative HMC` - Red line with 'x' markers (`x`).
4. `GAMP-RIE` - Red line with circle markers (`o`).
* **Grid:** A light gray grid is present, aiding in value estimation.
### Detailed Analysis
**Data Series and Trends:**
1. **Blue Group (Higher Starting Values):**
* **Trend:** Both blue lines show a steep, concave-upward decreasing trend. They drop rapidly from α=0 to α≈2, after which the rate of decrease slows, approaching a plateau.
* **ADAM (Blue, `o`):** Starts at the highest point on the y-axis (estimated ~0.95 at α=0). Decreases to approximately 0.25 at α=7. Error bars are present and appear relatively consistent in size across the range.
* **informative HMC (Blue, `+`):** Starts slightly below ADAM (estimated ~0.85 at α=0). Follows a very similar trajectory to ADAM, remaining slightly below it throughout. Ends at approximately 0.20 at α=7. Error bars are present.
2. **Red Group (Lower Starting Values):**
* **Trend:** The two red lines show different behaviors.
* **uninformative HMC (Red, `x`):** Shows a steep, concave-upward decreasing trend similar to the blue lines but starting from a much lower point. It decreases from an estimated ~0.35 at α=0 to near zero (~0.02) by α=7. Error bars are present and appear larger relative to the line's value, especially at lower α.
* **GAMP-RIE (Red, `o`):** This series is distinct. It appears as a nearly horizontal, dashed red line. Its value remains approximately constant at an estimated ~0.35 across the entire range of α from 0 to 7. It has very small, consistent error bars.
**Spatial Grounding & Value Estimation (Approximate):**
* At α=0: ADAM (~0.95) > informative HMC (~0.85) > uninformative HMC (~0.35) ≈ GAMP-RIE (~0.35).
* At α=3: ADAM (~0.35) > informative HMC (~0.30) > uninformative HMC (~0.10) > GAMP-RIE (~0.35). Note: GAMP-RIE is now the highest value.
* At α=7: ADAM (~0.25) > informative HMC (~0.20) > GAMP-RIE (~0.35) > uninformative HMC (~0.02). The red `x` line is the lowest.
### Key Observations
1. **Performance Crossover:** The decreasing red `x` line (uninformative HMC) crosses below the constant red `o` line (GAMP-RIE) at approximately α=1.5. This indicates that for α > 1.5, uninformative HMC achieves a lower (better) metric value than GAMP-RIE.
2. **Plateau vs. Constant:** The blue lines and the red `x` line show asymptotic behavior, suggesting their performance improves with α but with diminishing returns. In contrast, GAMP-RIE's performance is invariant to α.
3. **Error Bar Magnitude:** The error bars for the decreasing lines (especially uninformative HMC) are proportionally larger at small α, suggesting higher variance or uncertainty in the metric when α is small. The error bars for the constant GAMP-RIE line are very small.
4. **Group Separation:** There is a clear separation between the blue and red groups at low α, which narrows as α increases. The blue methods start worse but converge toward the performance level of the red methods.
### Interpretation
This chart likely illustrates the sensitivity of different optimization or inference algorithms to a hyperparameter α (which could represent something like step size, noise level, or model complexity).
* **What the data suggests:** The methods ADAM and informative HMC (blue) are highly sensitive to α, performing poorly at low α but improving significantly as α increases. Uninformative HMC (red `x`) is also sensitive but starts from a better baseline and ultimately achieves the best (lowest) metric value at high α. GAMP-RIE (red `o`) is robust/insensitive to α, providing consistent but not optimal performance across the board.
* **Relationships:** The similarity in trend between ADAM and informative HMC suggests they may share underlying algorithmic properties. The stark difference between informative and uninformative HMC highlights the impact of prior information ("informative" vs. "uninformative") on the algorithm's behavior and its interaction with α.
* **Notable Anomaly/Takeaway:** The key insight is the trade-off between peak performance and robustness. If one can set α appropriately high (e.g., α > 4), uninformative HMC is the best choice. If α is unknown, variable, or must be kept low, GAMP-RIE offers reliable, though sub-optimal, performance. The blue methods appear to be dominated by the red ones in this specific metric and range of α.