\n
## Diagram: LLM Reasoning Approaches
### Overview
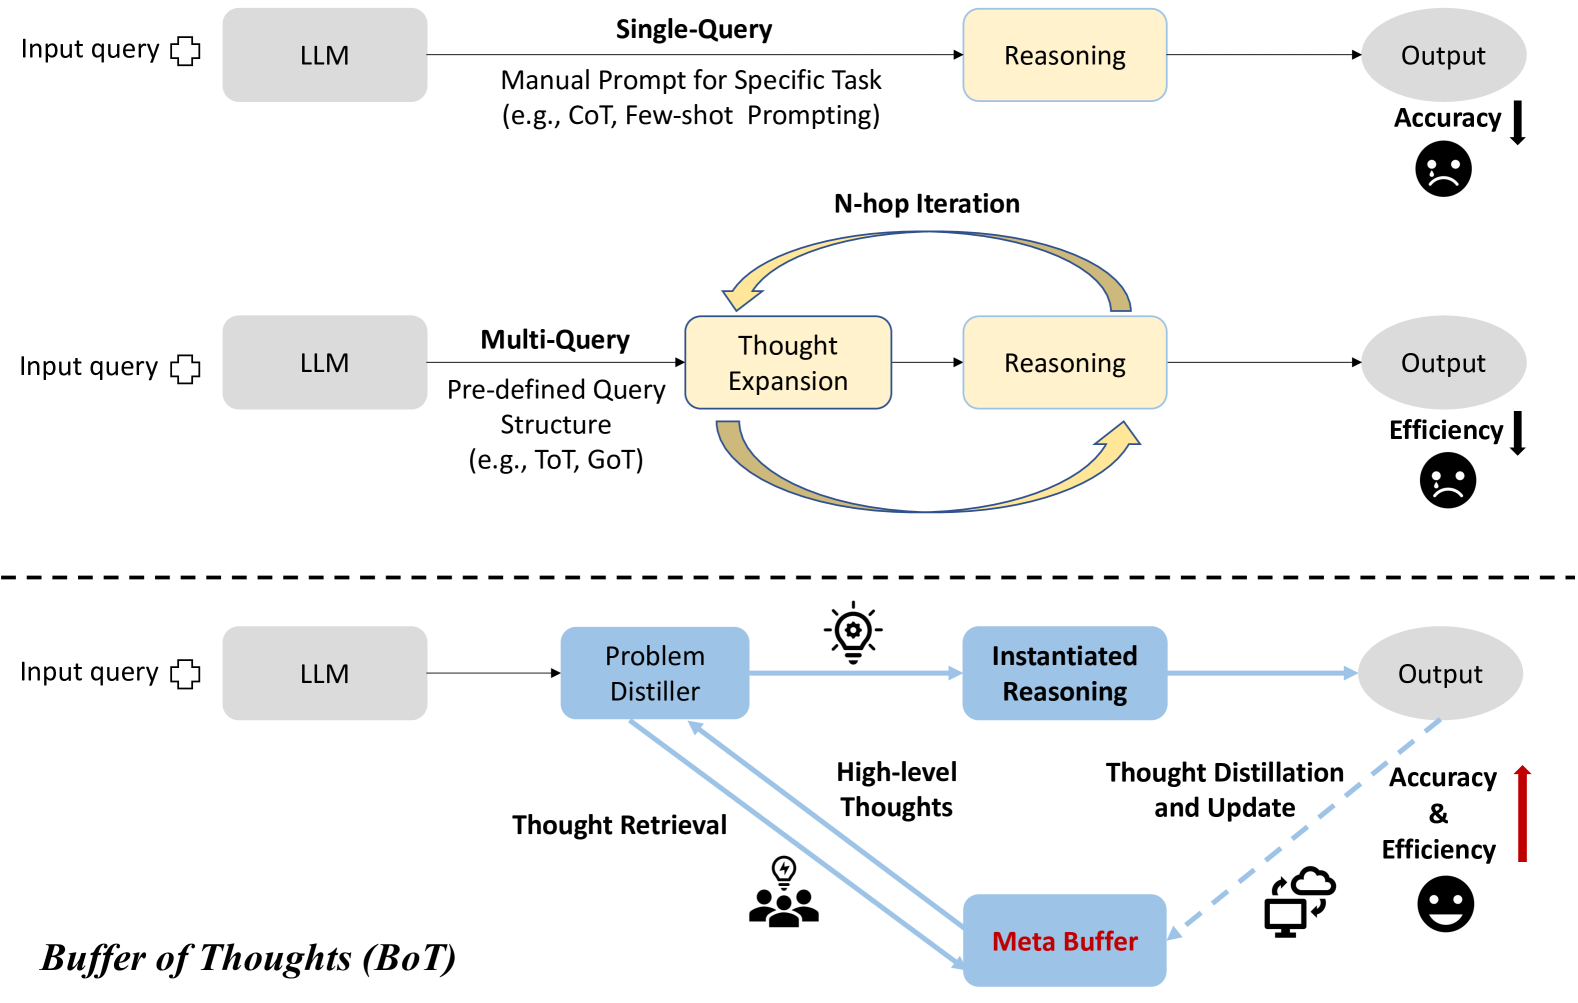
This diagram illustrates three different approaches to reasoning with Large Language Models (LLMs), comparing their processes and outcomes in terms of accuracy and efficiency. The approaches are Single-Query, Multi-Query, and a Buffer of Thoughts (BoT) method. Each approach is depicted as a flow diagram, showing the progression from input query to output, with intermediate steps of LLM processing and reasoning. The diagram also visually indicates the relative accuracy and efficiency of each approach using downward or upward arrows and corresponding emoticons.
### Components/Axes
The diagram consists of three horizontal sections, each representing a different reasoning approach. Each section includes the following components:
* **Input query:** Represented by a cloud-shaped icon.
* **LLM:** A rectangular box labeled "LLM".
* **Intermediate Steps:** Boxes representing processing stages (e.g., Reasoning, Thought Expansion, Problem Distiller, Instantiated Reasoning).
* **Output:** A rounded rectangular box labeled "Output".
* **Arrows:** Indicate the flow of information between components.
* **Text Annotations:** Explanatory text describing the process within each approach.
* **Accuracy/Efficiency Indicators:** Downward or upward arrows with corresponding emoticons to indicate relative performance.
* **"N-hop Iteration"**: Text indicating iterative process in the Multi-Query approach.
* **"Buffer of Thoughts (BoT)"**: Label for the third approach.
* **"Meta Buffer"**: A rectangular box within the BoT approach.
### Detailed Analysis or Content Details
**1. Single-Query Approach (Top Section):**
* Input query flows to the LLM.
* LLM performs "Reasoning" (Manual Prompt for Specific Task, e.g., CoT, Few-shot Prompting).
* Output is generated.
* Accuracy is indicated by a downward arrow and a sad face emoticon.
**2. Multi-Query Approach (Middle Section):**
* Input query flows to the LLM.
* LLM utilizes a "Multi-Query" approach with a "Pre-defined Query Structure" (e.g., ToT, GoT).
* This leads to "Thought Expansion".
* "Thought Expansion" feeds into "Reasoning".
* "Reasoning" generates the Output.
* The process is labeled as "N-hop Iteration" with a curved arrow indicating a loop.
* Efficiency is indicated by a downward arrow and a sad face emoticon.
**3. Buffer of Thoughts (BoT) Approach (Bottom Section):**
* Input query flows to the LLM.
* LLM uses a "Problem Distiller".
* "Problem Distiller" generates "High-level Thoughts".
* "High-level Thoughts" are retrieved from a "Buffer of Thoughts" (BoT) and are represented by a person icon with a lightning bolt.
* "High-level Thoughts" are used in "Instantiated Reasoning".
* "Instantiated Reasoning" undergoes "Thought Distillation and Update" using a "Meta Buffer".
* Output is generated.
* Accuracy and Efficiency are indicated by an upward arrow and a smiling face emoticon.
### Key Observations
* The diagram visually represents a progression in complexity and performance. The Single-Query approach is the simplest but least effective, while the BoT approach is the most complex but most effective.
* The use of arrows and emoticons provides a clear and intuitive understanding of the relative performance of each approach.
* The BoT approach incorporates a feedback loop ("Thought Distillation and Update") suggesting a continuous improvement process.
* The "N-hop Iteration" in the Multi-Query approach indicates a repetitive process, potentially contributing to its lower efficiency.
### Interpretation
The diagram demonstrates a comparative analysis of different reasoning strategies for LLMs. It suggests that more sophisticated approaches, like the Buffer of Thoughts (BoT) method, can significantly improve both accuracy and efficiency compared to simpler methods like Single-Query. The BoT approach, by leveraging a "Buffer of Thoughts" and a "Meta Buffer" for distillation and update, appears to mimic a more human-like reasoning process, allowing the LLM to learn and refine its responses over time. The diagram highlights the trade-offs between simplicity and performance, suggesting that investing in more complex reasoning architectures can yield substantial benefits in terms of output quality and resource utilization. The use of visual cues (arrows, emoticons) effectively communicates the relative strengths and weaknesses of each approach, making the diagram accessible to a broad audience. The diagram is not presenting data, but rather a conceptual model of different approaches. It is a qualitative comparison, not a quantitative one.