## Line Graph and Bar Chart: Speedup Analysis
### Overview
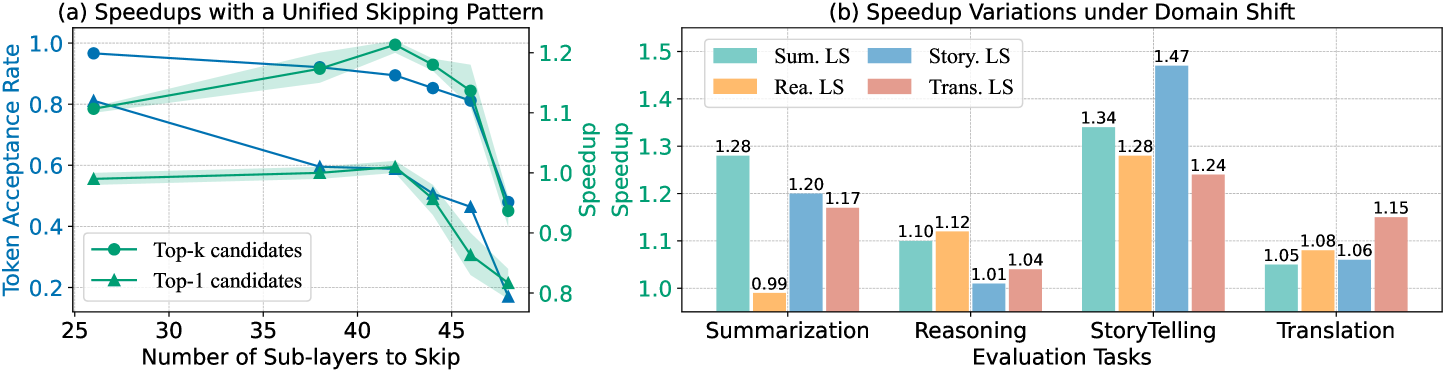
The image contains two visualizations:
1. **(a) Speedups with a Unified Skipping Pattern**: A line graph comparing token acceptance rates for Top-k and Top-1 candidates across varying numbers of skipped sub-layers.
2. **(b) Speedup Variations under Domain Shift**: A bar chart comparing speedup magnitudes across four evaluation tasks (Summarization, Reasoning, Storytelling, Translation) for four language-specific (LS) methods (Sum. LS, Story. LS, Rea. LS, Trans. LS).
---
### Components/Axes
#### Chart (a):
- **X-axis**: "Number of Sub-layers to Skip" (25–45, integer increments).
- **Y-axis**: "Token Acceptance Rate" (0.2–1.0, linear scale).
- **Legend**: Located at the bottom-right, with two entries:
- **Top-k candidates** (green circles, shaded green).
- **Top-1 candidates** (blue triangles, shaded blue).
#### Chart (b):
- **X-axis**: "Evaluation Tasks" (Summarization, Reasoning, Storytelling, Translation).
- **Y-axis**: "Speedup" (1.0–1.5, linear scale).
- **Legend**: Located at the top-right, with four entries:
- **Sum. LS** (green bars).
- **Story. LS** (blue bars).
- **Rea. LS** (orange bars).
- **Trans. LS** (red bars).
---
### Detailed Analysis
#### Chart (a):
- **Top-k candidates** (green):
- Starts at ~0.8 (25 sub-layers skipped).
- Peaks at ~0.95 (40 sub-layers skipped).
- Declines sharply to ~0.6 (45 sub-layers skipped).
- **Top-1 candidates** (blue):
- Starts at ~0.6 (25 sub-layers skipped).
- Peaks at ~0.8 (35 sub-layers skipped).
- Declines to ~0.4 (45 sub-layers skipped).
- **Trend**: Both lines show initial improvement with skipped sub-layers, followed by a decline. Top-k maintains higher acceptance rates overall.
#### Chart (b):
- **Summarization**:
- Sum. LS: 1.28 (highest).
- Story. LS: 1.20.
- Rea. LS: 0.99 (lowest).
- Trans. LS: 1.17.
- **Reasoning**:
- Sum. LS: 1.10.
- Story. LS: 1.01 (lowest).
- Rea. LS: 1.12 (highest).
- Trans. LS: 1.04.
- **Storytelling**:
- Sum. LS: 1.34.
- Story. LS: 1.47 (highest).
- Rea. LS: 1.28.
- Trans. LS: 1.24.
- **Translation**:
- Sum. LS: 1.05.
- Story. LS: 1.06.
- Rea. LS: 1.08.
- Trans. LS: 1.15 (highest).
---
### Key Observations
1. **Chart (a)**:
- Top-k candidates outperform Top-1 across all skipped sub-layers.
- Optimal skipping occurs at ~40 sub-layers for Top-k and ~35 for Top-1.
- Confidence intervals (shaded areas) suggest moderate uncertainty in Top-1 performance.
2. **Chart (b)**:
- **Storytelling** achieves the highest speedup (1.47) with Story. LS.
- **Summarization** benefits most from Sum. LS (1.28).
- **Translation** shows minimal speedup across all LS methods (<1.2).
- Rea. LS underperforms in Summarization (0.99) but excels in Reasoning (1.12).
---
### Interpretation
- **Chart (a)** demonstrates that skipping sub-layers improves token acceptance up to a threshold, after which performance degrades. Top-k candidates are more robust to skipping than Top-1.
- **Chart (b)** reveals task-specific dependencies:
- Storytelling and Summarization benefit from LS methods aligned with their domain (e.g., Story. LS for Storytelling).
- Rea. LS underperforms in Summarization, suggesting task-LS mismatches reduce efficiency.
- Translation shows minimal speedup, indicating limited gains from skipping in this domain.
The data underscores the importance of task-specific optimization when applying sub-layer skipping and LS methods. Outliers like Rea. LS in Summarization highlight potential pitfalls of generic approaches.