## Chart: Speedups with Skipping and Domain Shift
### Overview
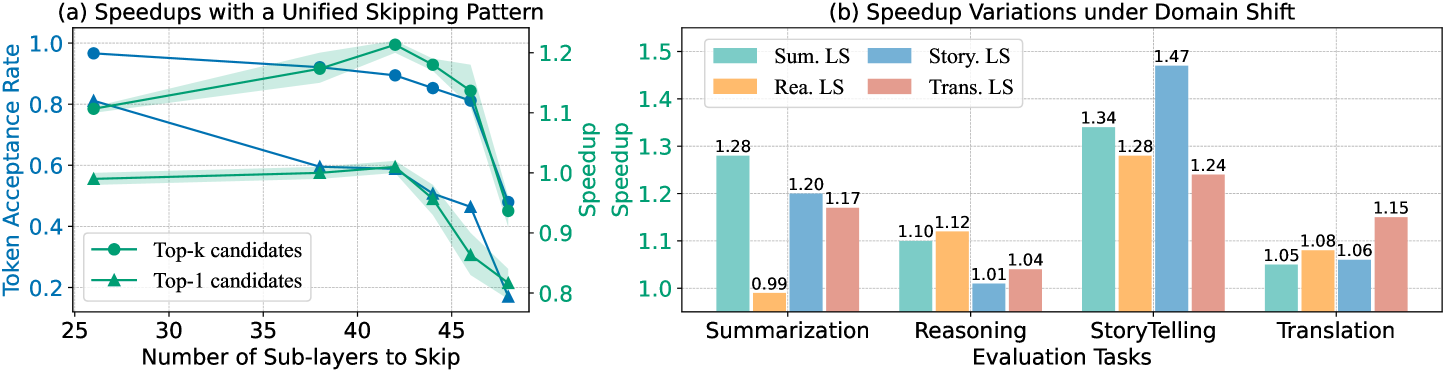
The image presents two charts. The first (a) shows the relationship between the number of sub-layers skipped and the token acceptance rate for two different candidate selection methods (Top-k and Top-1). The second chart (b) displays speedup variations across different evaluation tasks (Summarization, Reasoning, Storytelling, and Translation) under domain shift conditions.
### Components/Axes
**Chart (a): Speedups with a Unified Skipping Pattern**
* **X-axis:** Number of Sub-layers to Skip (ranging from approximately 25 to 45, with markers at 25, 30, 35, 40, 45).
* **Y-axis (left):** Token Acceptance Rate (ranging from approximately 0.2 to 1.0).
* **Y-axis (right):** Speedup (ranging from approximately 0.8 to 1.2).
* **Legend:**
* Top-k candidates (represented by a dark blue line with triangle markers)
* Top-1 candidates (represented by a light blue line with triangle markers)
**Chart (b): Speedup Variations under Domain Shift**
* **X-axis:** Evaluation Tasks (Summarization, Reasoning, Storytelling, Translation).
* **Y-axis:** Speedup (ranging from approximately 0.8 to 1.5).
* **Legend:**
* Sum. LS (represented by an orange bar)
* Rea. LS (represented by a light green bar)
* Story. LS (represented by a teal bar)
* Trans. LS (represented by a red bar)
### Detailed Analysis or Content Details
**Chart (a):**
* **Top-k candidates:** The line starts at approximately 0.95 at 25 sub-layers skipped, decreases to approximately 0.75 at 35 sub-layers, then increases to approximately 0.9 at 45 sub-layers.
* **Top-1 candidates:** The line starts at approximately 0.85 at 25 sub-layers skipped, decreases sharply to approximately 0.25 at 35 sub-layers, and then increases to approximately 0.4 at 45 sub-layers.
* The speedup axis is not directly tied to the lines, but appears to be a secondary indicator.
**Chart (b):**
* **Summarization:** Sum. LS = 0.99
* **Reasoning:** Rea. LS = 1.17, and a second value of 1.12 is present.
* **Storytelling:** Story. LS = 1.34
* **Translation:** Trans. LS = 1.24
* The bars represent the speedup for each task.
### Key Observations
* In Chart (a), increasing the number of skipped sub-layers initially decreases the token acceptance rate for both Top-k and Top-1 candidates, but the rate recovers somewhat at higher skip numbers. Top-1 candidates experience a more dramatic initial drop in acceptance rate.
* In Chart (b), Storytelling shows the highest speedup (1.34), while Summarization has the lowest (0.99). Reasoning has two values, suggesting potential variance or multiple measurements.
### Interpretation
The data suggests that skipping sub-layers can be a viable strategy for accelerating model performance, but it comes with a trade-off in token acceptance rate. The optimal number of sub-layers to skip appears to depend on the candidate selection method used. Top-1 candidates are more sensitive to skipping than Top-k candidates.
Chart (b) indicates that the effectiveness of this acceleration strategy varies across different NLP tasks. Storytelling benefits the most from the domain shift, while Summarization sees the least improvement. The presence of two values for Reasoning suggests that the speedup may be less consistent for this task.
The "LS" in the legend for Chart (b) likely refers to a specific domain shift or evaluation setting (e.g., Low-resource setting). The charts demonstrate the impact of this domain shift on the speedup achieved for each task. The data suggests that the benefits of skipping sub-layers are not uniform across all tasks and are influenced by the evaluation context.