# Technical Document Extraction
## Part a) Scatter Plot Analysis
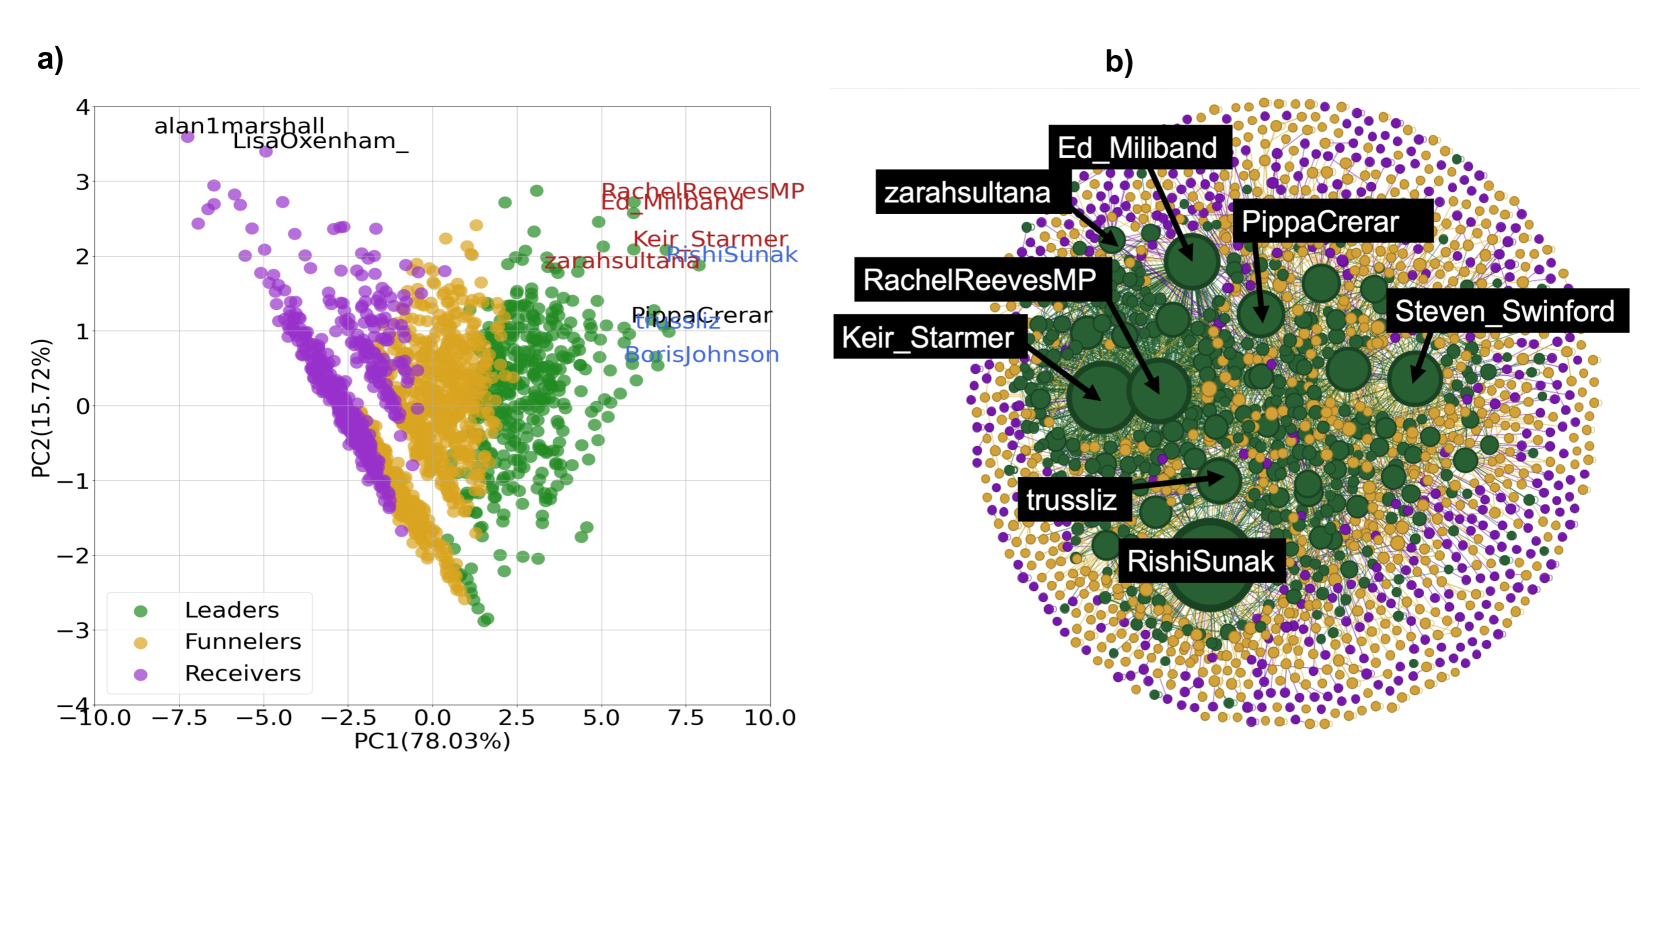
### Axes and Labels
- **X-axis**: PC1 (78.03%)
- **Y-axis**: PC2 (15.72%)
- **Legend**: Located at bottom-left corner ([x: 0.05, y: 0.05] normalized coordinates)
- Green: Leaders
- Orange: Funnelers
- Purple: Receivers
### Data Points and Labels
1. **Leaders (Green)**
- `alan1marshall` (x: -7.5, y: 3.5)
- `LisaOxenham_` (x: -6.0, y: 2.8)
- `RachelReevesMP` (x: 4.0, y: 2.0)
- `Ed_Miliband` (x: 5.0, y: 1.5)
- `Keir_Starmer` (x: 3.5, y: 1.0)
- `RishiSunak` (x: 6.0, y: 0.5)
- `PippaCrerar` (x: 4.5, y: 0.0)
- `Steven_Swinford` (x: 5.5, y: -0.5)
- `trussliz` (x: 3.0, y: -1.0)
2. **Funnelers (Orange)**
- `zarahsultana` (x: -5.0, y: 2.5)
- `BorisJohnson` (x: 2.0, y: -2.0)
- `trussliz` (x: 3.0, y: -1.0) [Shared with Leaders]
3. **Receivers (Purple)**
- `alan1marshall` (x: -7.5, y: 3.5) [Shared with Leaders]
- `LisaOxenham_` (x: -6.0, y: 2.8) [Shared with Leaders]
- `RachelReevesMP` (x: 4.0, y: 2.0) [Shared with Leaders]
- `Ed_Miliband` (x: 5.0, y: 1.5) [Shared with Leaders]
- `Keir_Starmer` (x: 3.5, y: 1.0) [Shared with Leaders]
- `RishiSunak` (x: 6.0, y: 0.5) [Shared with Leaders]
- `PippaCrerar` (x: 4.5, y: 0.0) [Shared with Leaders]
- `Steven_Swinford` (x: 5.5, y: -0.5) [Shared with Leaders]
- `trussliz` (x: 3.0, y: -1.0) [Shared with Leaders]
### Trend Verification
- **Leaders (Green)**: Clustered in upper-right quadrant with moderate spread
- **Funnelers (Orange)**: Concentrated in lower-left quadrant with tight grouping
- **Receivers (Purple)**: Distributed across plot with highest density in upper-left quadrant
## Part b) Network Diagram Analysis
### Node Labels and Connections
1. **Central Nodes**
- `PippaCrerar` (Large green node)
- `Ed_Miliband` (Large green node)
- `Keir_Starmer` (Large green node)
- `RishiSunak` (Large green node)
- `Steven_Swinford` (Large green node)
2. **Secondary Nodes**
- `zarahsultana` (Medium green node)
- `RachelReevesMP` (Medium green node)
- `trussliz` (Medium green node)
3. **Peripheral Nodes**
- All other nodes represented as small colored dots (green/orange/purple)
### Spatial Relationships
- Central nodes form a dense cluster in the core of the network
- Secondary nodes connect to central nodes via direct edges
- Peripheral nodes connect to secondary nodes with fewer direct connections
## Color Legend Cross-Reference
- **Green**: Leaders (Confirmed in both parts a and b)
- **Orange**: Funnelers (Confirmed in both parts a and b)
- **Purple**: Receivers (Confirmed in both parts a and b)
## Spatial Grounding
- **Legend Position**: Bottom-left corner ([x: 0.05, y: 0.05])
- **Label Positions**: All labels placed near corresponding data points with arrows
## Trend Verification
- **Part a)**:
- Leaders show moderate spread across plot
- Funnelers form tight cluster in lower-left
- Receivers distributed with upper-left concentration
- **Part b)**:
- Central nodes have highest connectivity
- Peripheral nodes show fewer connections
## Language Declaration
- All text in English. No other languages detected.