## Scatter Plot: Byte-Mean Log-Likelihood vs. Text Length by Source
### Overview
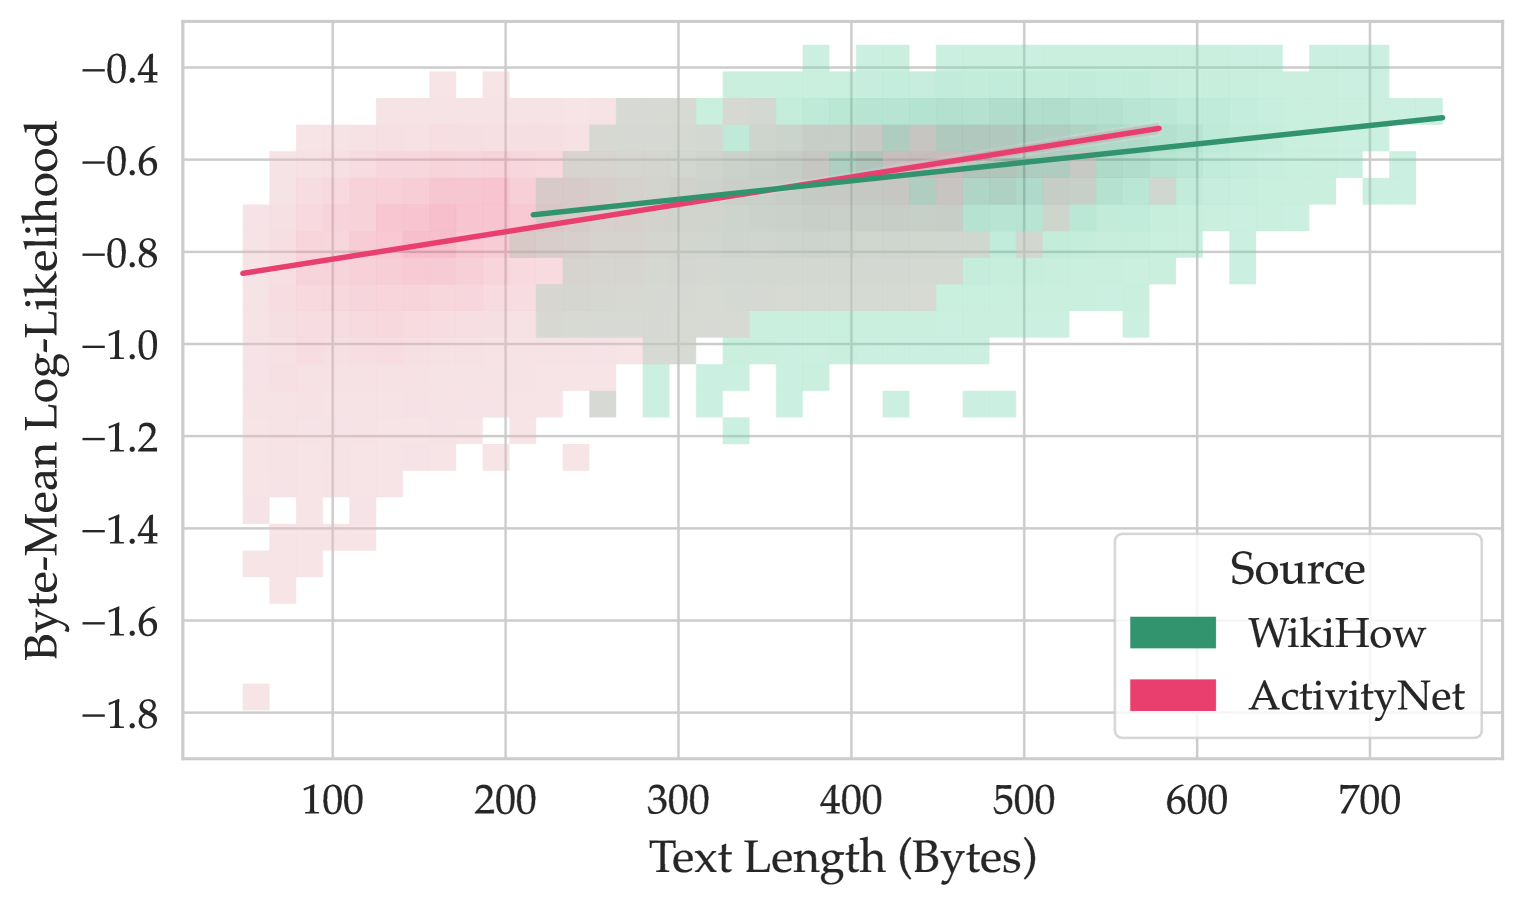
The image is a scatter plot showing the relationship between "Byte-Mean Log-Likelihood" and "Text Length (Bytes)" for two different sources: WikiHow and ActivityNet. The plot includes trend lines for each source, visually representing the general trend of the data. The data points are represented as density maps, with color intensity indicating the concentration of points.
### Components/Axes
* **X-axis:** Text Length (Bytes), ranging from 0 to 700, with tick marks at 100, 200, 300, 400, 500, 600, and 700.
* **Y-axis:** Byte-Mean Log-Likelihood, ranging from -1.8 to -0.4, with tick marks at -1.8, -1.6, -1.4, -1.2, -1.0, -0.8, -0.6, and -0.4.
* **Legend (bottom-right):**
* WikiHow (Green)
* ActivityNet (Pink)
### Detailed Analysis
* **WikiHow (Green):**
* The density of WikiHow data points is concentrated in the upper-right region of the plot.
* The trend line for WikiHow slopes upward, starting at approximately (-0.7) at x=200 and ending at approximately (-0.5) at x=700.
* **ActivityNet (Pink):**
* The density of ActivityNet data points is concentrated in the lower-left region of the plot.
* The trend line for ActivityNet slopes upward, starting at approximately (-0.85) at x=50 and ending at approximately (-0.6) at x=600.
### Key Observations
* WikiHow generally has higher Byte-Mean Log-Likelihood values compared to ActivityNet.
* Both WikiHow and ActivityNet show a positive correlation between Text Length and Byte-Mean Log-Likelihood.
* The density of data points suggests that WikiHow texts tend to be longer than ActivityNet texts.
### Interpretation
The plot suggests that the source of the text (WikiHow vs. ActivityNet) is related to both the length of the text and its Byte-Mean Log-Likelihood. WikiHow texts tend to be longer and have higher Byte-Mean Log-Likelihood values, while ActivityNet texts tend to be shorter and have lower Byte-Mean Log-Likelihood values. The upward trend lines for both sources indicate that as text length increases, the Byte-Mean Log-Likelihood also tends to increase. This could be due to various factors, such as the complexity of the language used or the structure of the text. The difference in distribution between the two sources could reflect differences in the nature of the content they contain.