\n
## Scatter Plot with Regression Lines: Byte-Mean Log-Likelihood vs. Text Length
### Overview
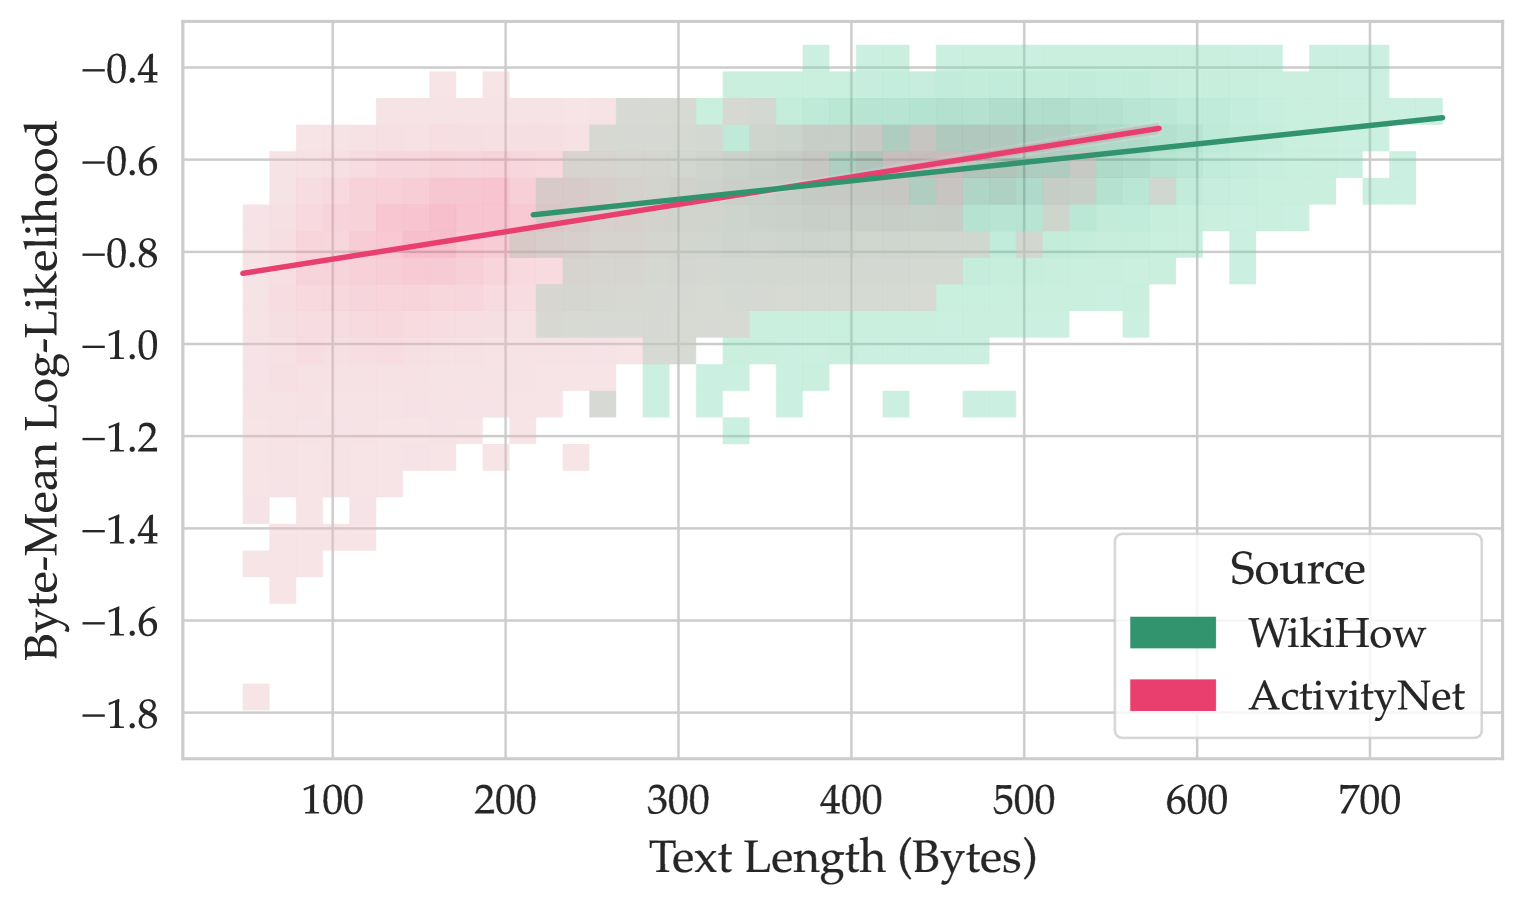
This image presents a scatter plot visualizing the relationship between "Text Length (Bytes)" and "Byte-Mean Log-Likelihood" for three different data sources: WikiHow, ActivityNet, and a general source (represented in light green). Each source is represented by a cloud of points, and a linear regression line is fitted to each cloud, indicating the trend of the relationship. The plot appears to be a heatmap-style scatter plot, where the density of points is represented by the color intensity.
### Components/Axes
* **X-axis:** "Text Length (Bytes)", ranging from approximately 50 to 750 bytes. The axis is marked with increments of 100.
* **Y-axis:** "Byte-Mean Log-Likelihood", ranging from approximately -1.8 to -0.2. The axis is marked with increments of 0.2.
* **Legend (Top-Right):**
* Light Green: Source (likely a baseline or combined source)
* Dark Green: WikiHow
* Pink/Red: ActivityNet
* **Data Series:** Three distinct data series, each representing one of the sources listed in the legend. Each series is represented by a cloud of points with varying density and a fitted regression line.
### Detailed Analysis
Let's analyze each data series individually:
**1. Source (Light Green):**
* **Trend:** The points are scattered, with a slight upward trend. The regression line is relatively flat, indicating a weak positive correlation.
* **Data Points (Approximate):**
* At Text Length = 100 bytes, Byte-Mean Log-Likelihood ≈ -1.4
* At Text Length = 300 bytes, Byte-Mean Log-Likelihood ≈ -1.0
* At Text Length = 500 bytes, Byte-Mean Log-Likelihood ≈ -0.8
* At Text Length = 700 bytes, Byte-Mean Log-Likelihood ≈ -0.6
**2. WikiHow (Dark Green):**
* **Trend:** The points are concentrated in the range of 300-700 bytes. The regression line slopes upward, indicating a positive correlation between text length and byte-mean log-likelihood.
* **Data Points (Approximate):**
* At Text Length = 100 bytes, Byte-Mean Log-Likelihood ≈ -1.2
* At Text Length = 300 bytes, Byte-Mean Log-Likelihood ≈ -0.8
* At Text Length = 500 bytes, Byte-Mean Log-Likelihood ≈ -0.6
* At Text Length = 700 bytes, Byte-Mean Log-Likelihood ≈ -0.4
**3. ActivityNet (Pink/Red):**
* **Trend:** The points are concentrated in the range of 50-300 bytes. The regression line slopes upward, indicating a positive correlation between text length and byte-mean log-likelihood. The slope appears steeper than the WikiHow line.
* **Data Points (Approximate):**
* At Text Length = 100 bytes, Byte-Mean Log-Likelihood ≈ -0.8
* At Text Length = 200 bytes, Byte-Mean Log-Likelihood ≈ -0.6
* At Text Length = 300 bytes, Byte-Mean Log-Likelihood ≈ -0.4
* At Text Length = 400 bytes, Byte-Mean Log-Likelihood ≈ -0.2
### Key Observations
* All three sources show a positive correlation between text length and byte-mean log-likelihood, meaning that longer texts tend to have higher log-likelihoods.
* ActivityNet has the steepest positive slope, suggesting that its log-likelihood increases more rapidly with text length compared to WikiHow and the general source.
* The general source has the lowest log-likelihood values across all text lengths.
* The data for WikiHow and ActivityNet are more concentrated than the general source, indicating less variance within those datasets.
* The general source has data points extending to lower log-likelihoods and shorter text lengths than the other two sources.
### Interpretation
This data likely represents a model evaluation or comparison of different text sources. The "Byte-Mean Log-Likelihood" is a metric used to assess how well a language model predicts a given text sequence. A higher log-likelihood indicates a better fit.
The positive correlation between text length and log-likelihood suggests that longer texts are generally easier for the model to predict, potentially because they provide more context. The differences between the sources suggest that the models are better at predicting texts from WikiHow and ActivityNet than from the general source. This could be due to differences in the writing style, vocabulary, or topic distribution of the three sources.
The steeper slope for ActivityNet suggests that the model is particularly good at predicting longer texts from that source. This could be because ActivityNet texts are more structured or predictable. The general source's lower log-likelihoods and wider distribution suggest that it contains more diverse and potentially less predictable texts.
The plot provides insights into the model's performance on different types of text and could be used to inform decisions about data selection, model training, or model deployment.