## Scatter Plot with Trend Lines: Text Length vs. Byte-Mean Log-Likelihood by Source
### Overview
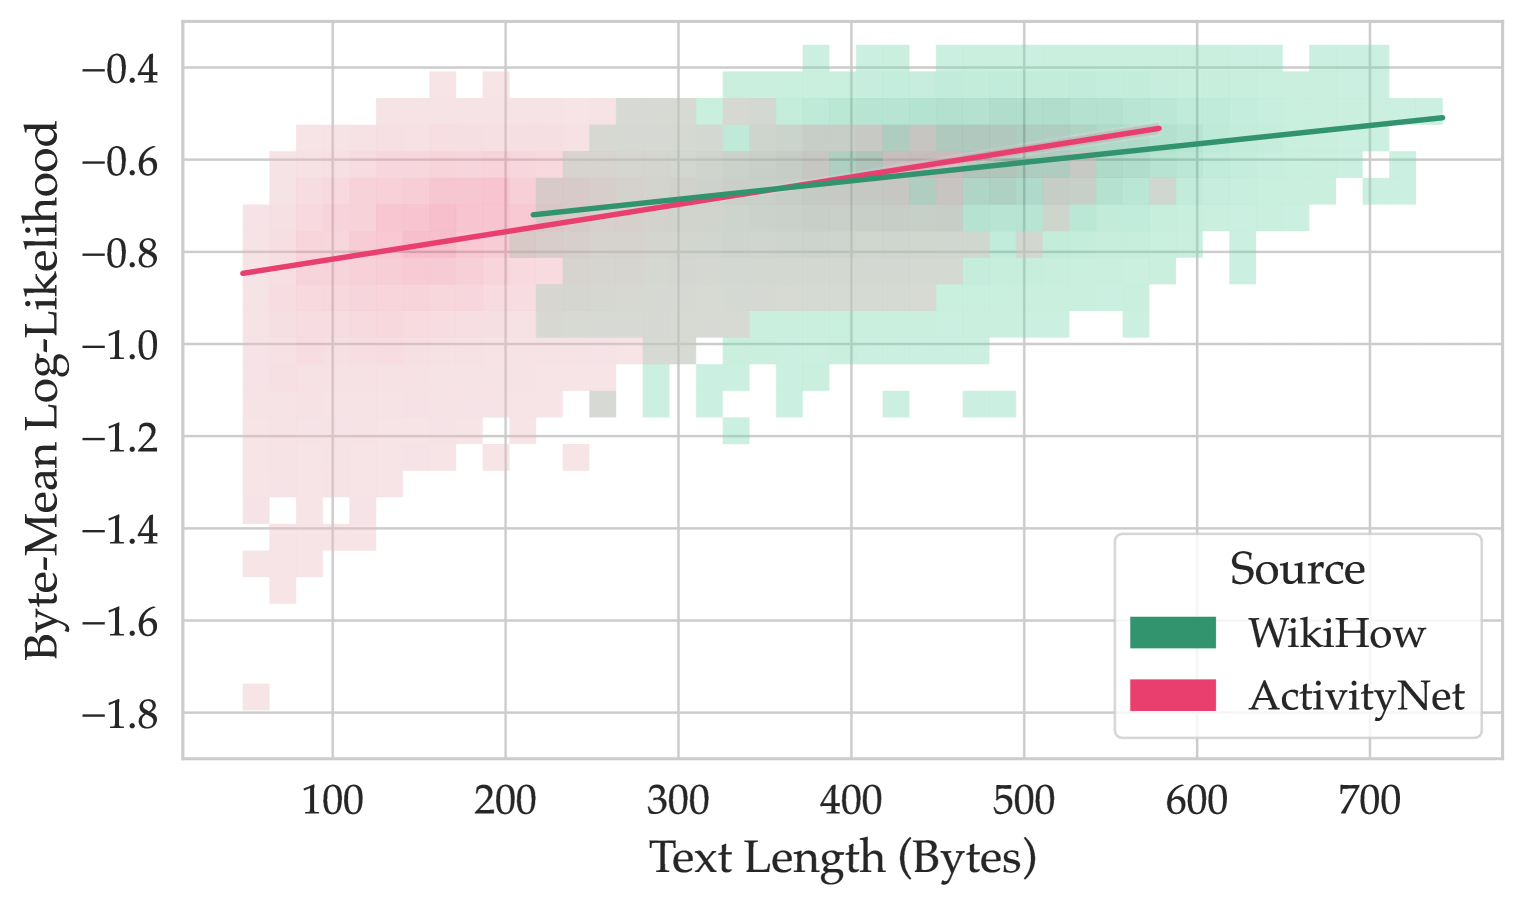
The image is a 2D scatter plot overlaid with two linear trend lines. It visualizes the relationship between the length of text (in bytes) and a metric called "Byte-Mean Log-Likelihood" for two distinct data sources: WikiHow and ActivityNet. The plot uses a 2D histogram or binned scatter approach, where the density of data points is represented by the opacity or color intensity of rectangular bins.
### Components/Axes
* **Chart Type:** 2D Histogram / Binned Scatter Plot with overlaid linear regression trend lines.
* **X-Axis:**
* **Label:** "Text Length (Bytes)"
* **Scale:** Linear, ranging from approximately 50 to 750 bytes.
* **Major Ticks:** 100, 200, 300, 400, 500, 600, 700.
* **Y-Axis:**
* **Label:** "Byte-Mean Log-Likelihood"
* **Scale:** Linear, ranging from -1.8 to -0.4.
* **Major Ticks:** -1.8, -1.6, -1.4, -1.2, -1.0, -0.8, -0.6, -0.4.
* **Legend:**
* **Position:** Bottom-right corner of the plot area.
* **Title:** "Source"
* **Entries:**
1. **WikiHow:** Represented by a dark green color. The associated data points are shown as green-tinted bins, and its trend line is a solid dark green line.
2. **ActivityNet:** Represented by a pink/magenta color. The associated data points are shown as pink-tinted bins, and its trend line is a solid pink line.
* **Data Representation:** The plot uses colored, semi-transparent rectangular bins. The overlap of the two datasets creates greyish areas where both green and pink bins coincide.
### Detailed Analysis
**1. Data Distribution & Density:**
* **ActivityNet (Pink):** Data points are concentrated in the lower text length range, primarily between ~50 and 300 bytes. The density (opacity) is highest in the region of 100-200 bytes and -1.0 to -0.6 on the y-axis. The distribution shows a wide vertical spread, especially at shorter text lengths, with some points reaching as low as -1.8.
* **WikiHow (Green):** Data points are concentrated in the higher text length range, primarily between ~200 and 750 bytes. The density is highest in the region of 300-600 bytes and -0.8 to -0.4. The distribution is more vertically compact compared to ActivityNet, especially at longer text lengths.
* **Overlap:** There is a significant region of overlap between approximately 200 and 500 bytes on the x-axis and -1.0 to -0.6 on the y-axis, indicated by the grey mixed bins.
**2. Trend Lines & Correlation:**
* **ActivityNet Trend Line (Pink):**
* **Visual Trend:** Slopes upward from left to right.
* **Approximate Path:** Starts near (50 bytes, -0.85) and ends near (580 bytes, -0.55).
* **Interpretation:** Indicates a positive correlation. As text length increases, the Byte-Mean Log-Likelihood for ActivityNet data tends to increase (become less negative).
* **WikiHow Trend Line (Green):**
* **Visual Trend:** Slopes upward from left to right, with a slightly steeper slope than the ActivityNet line.
* **Approximate Path:** Starts near (220 bytes, -0.72) and ends near (750 bytes, -0.50).
* **Interpretation:** Also indicates a positive correlation. The relationship appears slightly stronger (steeper slope) for WikiHow data.
**3. Key Data Points (Approximate from Trend Lines):**
* At **Text Length = 100 bytes:** ActivityNet trend ≈ -0.82; WikiHow trend not applicable (data sparse).
* At **Text Length = 300 bytes:** ActivityNet trend ≈ -0.70; WikiHow trend ≈ -0.68.
* At **Text Length = 500 bytes:** ActivityNet trend ≈ -0.58; WikiHow trend ≈ -0.58.
* At **Text Length = 700 bytes:** ActivityNet trend not applicable (data sparse); WikiHow trend ≈ -0.52.
### Key Observations
1. **Distinct Data Ranges:** The two sources occupy largely different domains of text length. ActivityNet is characterized by shorter texts, while WikiHow is characterized by longer texts.
2. **Positive Correlation for Both:** Both datasets show that longer text length is associated with a higher (less negative) Byte-Mean Log-Likelihood.
3. **Convergence of Trends:** The two trend lines intersect and are very close in value in the overlapping region around 300-500 bytes, suggesting similar model likelihood behavior for texts of that length regardless of source.
4. **Variance:** ActivityNet shows much higher variance in the Byte-Mean Log-Likelihood metric, particularly for short texts, as evidenced by the tall vertical spread of pink bins. WikiHow's variance appears lower and more consistent across its range.
5. **Outliers:** There are isolated, low-density bins for ActivityNet at very low likelihoods (e.g., near -1.8 at ~50 bytes), which may represent outliers or particularly atypical short texts.
### Interpretation
This chart likely analyzes the performance or characteristics of a language or sequence model. "Byte-Mean Log-Likelihood" is a metric where higher values (closer to zero) indicate the model finds the data more probable or "less surprising."
The data suggests that **both WikiHow and ActivityNet texts become more "predictable" or "model-friendly" as they get longer.** This is a common phenomenon in language modeling, as longer contexts provide more information for prediction.
The key investigative insight is the **source-dependent behavior.** WikiHow, presumably containing instructional, well-structured text, consistently yields higher likelihoods and shows a stronger positive trend. ActivityNet, likely containing more varied, noisy, or informal descriptions of activities, has lower average likelihoods and much higher variance, especially in short snippets. The convergence in the middle suggests that for medium-length texts (~400 bytes), the source matters less to the model's assessment of likelihood. This analysis could be used to understand dataset biases, model calibration, or to guide data preprocessing (e.g., filtering very short, low-likelihood texts from ActivityNet).