## Scatter Plot: Byte-Mean Log-Likelihood vs. Text Length (Bytes)
### Overview
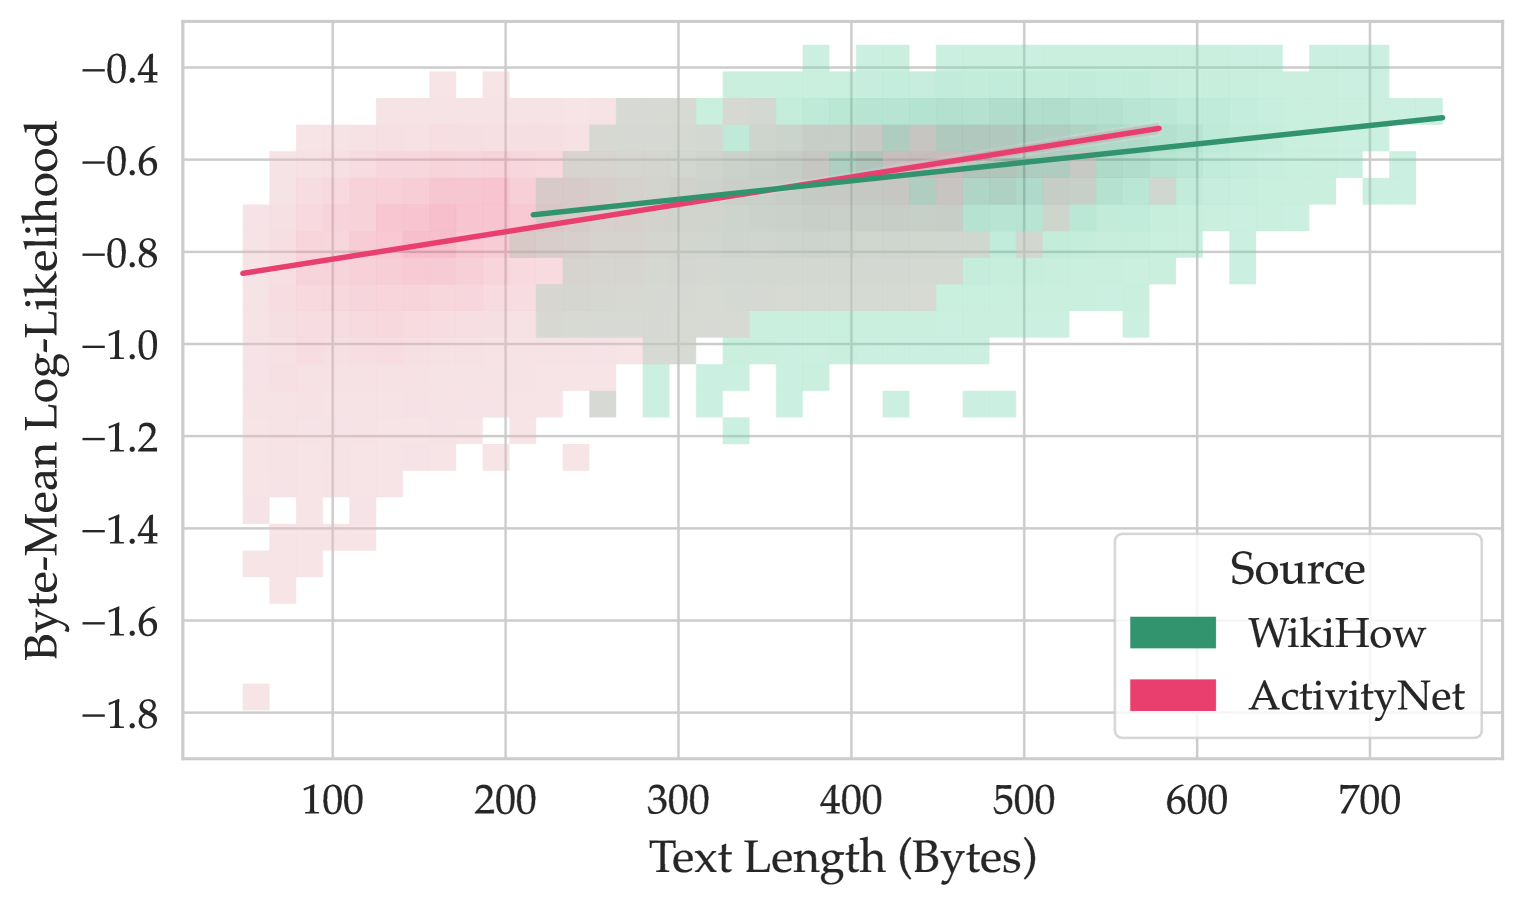
The image is a scatter plot comparing the relationship between text length (bytes) and byte-mean log-likelihood for two data sources: WikiHow (green) and ActivityNet (red). Two trend lines are overlaid on the data points, and shaded regions indicate data density distributions.
---
### Components/Axes
- **X-Axis**: "Text Length (Bytes)" ranging from 100 to 700 bytes in increments of 100.
- **Y-Axis**: "Byte-Mean Log-Likelihood" ranging from -1.8 to -0.4 in increments of 0.2.
- **Legend**: Located in the bottom-right corner, with:
- **Green**: WikiHow
- **Red**: ActivityNet
- **Trend Lines**:
- **Green Line**: WikiHow (slightly above red line)
- **Red Line**: ActivityNet (slightly below green line)
- **Shaded Regions**:
- **Green**: WikiHow data density (darker in upper-right quadrant)
- **Red**: ActivityNet data density (darker in lower-left quadrant)
---
### Detailed Analysis
1. **WikiHow (Green)**:
- **Data Points**: Clustered densely in the upper-right quadrant (text lengths: 400–700 bytes; log-likelihood: -0.4 to -0.6).
- **Trend Line**: Positive slope, starting near (-1.0, 100 bytes) and ending near (-0.4, 700 bytes).
- **Density**: Highest concentration between 400–600 bytes.
2. **ActivityNet (Red)**:
- **Data Points**: Clustered densely in the lower-left quadrant (text lengths: 100–300 bytes; log-likelihood: -1.2 to -0.8).
- **Trend Line**: Positive slope, starting near (-1.2, 100 bytes) and ending near (-0.6, 500 bytes).
- **Density**: Highest concentration between 100–300 bytes.
3. **Overlap**:
- Shaded regions overlap between 200–400 bytes, with mixed densities (green and red).
---
### Key Observations
1. **WikiHow Dominates Longer Texts**:
- WikiHow texts are longer (400–700 bytes) and have higher log-likelihood (-0.4 to -0.6) compared to ActivityNet.
2. **ActivityNet Favors Shorter Texts**:
- ActivityNet texts are shorter (100–300 bytes) with lower log-likelihood (-1.2 to -0.8).
3. **Trend Lines**:
- Both lines show a positive correlation between text length and log-likelihood, but WikiHow’s line is consistently higher.
4. **Data Density**:
- WikiHow’s density decreases sharply after 600 bytes; ActivityNet’s density tapers off after 300 bytes.
---
### Interpretation
- **Structural Differences**: WikiHow’s higher log-likelihood suggests more predictable or structured text (e.g., instructional content), while ActivityNet’s lower log-likelihood may reflect variability or noise in its data (e.g., user-generated content).
- **Overlap Implications**: The middle range (200–400 bytes) shows mixed performance, indicating some texts from both sources share similar characteristics.
- **Anomalies**: A single outlier at ~100 bytes (red) in ActivityNet has a log-likelihood near -1.8, suggesting an outlier in shorter texts.
The data highlights a clear divergence in text properties between the two sources, with WikiHow favoring longer, more coherent texts and ActivityNet dominated by shorter, less predictable content.