## Line Chart: MER Average vs. N
### Overview
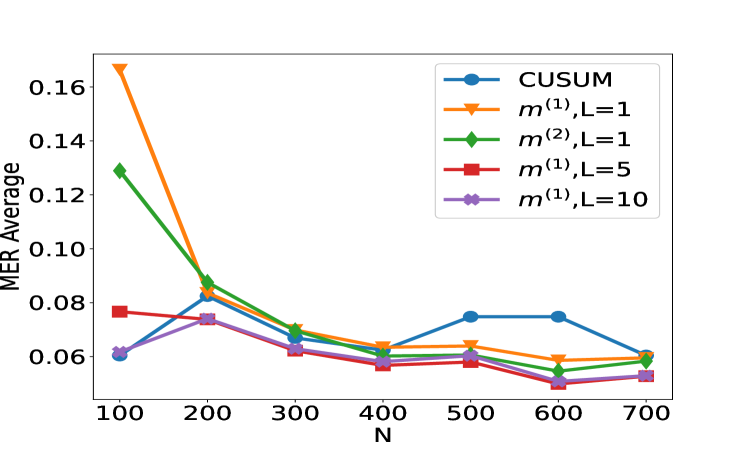
The image is a line chart comparing the MER (Missing Error Rate) Average for different methods (CUSUM, m^(1), m^(2)) with varying parameter L, as a function of N. The x-axis represents N, ranging from 100 to 700. The y-axis represents the MER Average, ranging from 0.06 to 0.16. There are five lines on the chart, each representing a different method and parameter setting.
### Components/Axes
* **X-axis:** N, with markers at 100, 200, 300, 400, 500, 600, and 700.
* **Y-axis:** MER Average, with markers at 0.06, 0.08, 0.10, 0.12, 0.14, and 0.16.
* **Legend (top-right):**
* Blue line with circle markers: CUSUM
* Orange line with triangle markers: m^(1), L=1
* Green line with diamond markers: m^(2), L=1
* Red line with square markers: m^(1), L=5
* Purple line with double-circle markers: m^(1), L=10
### Detailed Analysis
* **CUSUM (Blue):** The line starts at approximately 0.06 at N=100, increases to approximately 0.085 at N=200, then decreases to approximately 0.065 at N=300 and N=400. It then increases to approximately 0.075 at N=500 and N=600, before decreasing to approximately 0.06 at N=700.
* **m^(1), L=1 (Orange):** The line starts at approximately 0.165 at N=100, decreases sharply to approximately 0.085 at N=200, then decreases gradually to approximately 0.07 at N=300, approximately 0.065 at N=400, approximately 0.063 at N=500, approximately 0.058 at N=600, and approximately 0.06 at N=700.
* **m^(2), L=1 (Green):** The line starts at approximately 0.13 at N=100, decreases sharply to approximately 0.085 at N=200, then decreases gradually to approximately 0.07 at N=300, approximately 0.065 at N=400, approximately 0.06 at N=500, approximately 0.052 at N=600, and approximately 0.06 at N=700.
* **m^(1), L=5 (Red):** The line starts at approximately 0.077 at N=100, decreases to approximately 0.075 at N=200, then decreases gradually to approximately 0.063 at N=300, approximately 0.057 at N=400, approximately 0.058 at N=500, approximately 0.052 at N=600, and approximately 0.054 at N=700.
* **m^(1), L=10 (Purple):** The line starts at approximately 0.062 at N=100, increases to approximately 0.075 at N=200, then decreases gradually to approximately 0.065 at N=300, approximately 0.06 at N=400, approximately 0.062 at N=500, approximately 0.052 at N=600, and approximately 0.056 at N=700.
### Key Observations
* The MER Average generally decreases as N increases for most methods, especially for m^(1), L=1 and m^(2), L=1.
* CUSUM shows a more fluctuating behavior compared to the other methods.
* m^(1), L=5 and m^(1), L=10 have relatively lower MER Average values compared to CUSUM, m^(1), L=1, and m^(2), L=1.
### Interpretation
The chart suggests that the methods m^(1), L=5 and m^(1), L=10 are more effective in reducing the Missing Error Rate (MER) compared to CUSUM, m^(1), L=1, and m^(2), L=1, especially as N increases. The fluctuating behavior of CUSUM indicates that it might be more sensitive to changes in N. The sharp decrease in MER Average for m^(1), L=1 and m^(2), L=1 as N increases from 100 to 200 suggests that these methods benefit significantly from an initial increase in N, but their performance plateaus afterward. The methods m^(1), L=5 and m^(1), L=10 appear to be more stable and consistently perform well across different values of N.