## Line Chart: MER Average vs. N for Different Algorithms
### Overview
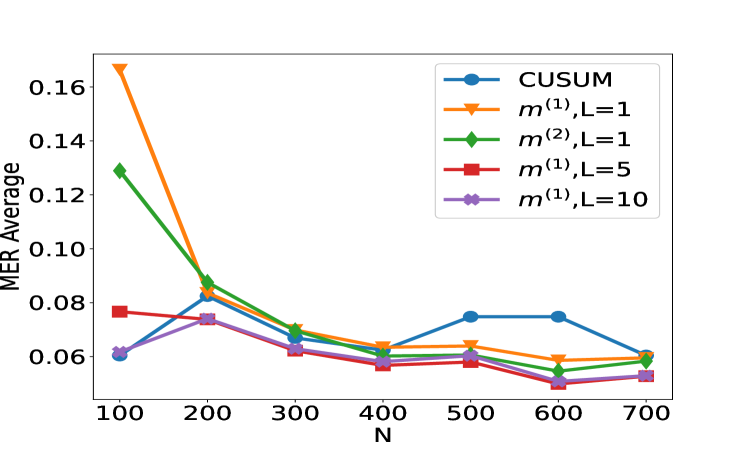
The image presents a line chart comparing the Mean Error Rate (MER) Average for several algorithms as a function of 'N', likely representing sample size or number of iterations. The algorithms are CUSUM, m^(1),L=1, m^(2),L=1, m^(1),L=5, and m^(1),L=10. The chart visually demonstrates how the MER Average changes with increasing N for each algorithm.
### Components/Axes
* **X-axis:** Labeled "N", ranging from approximately 100 to 700, with tick marks at 100, 200, 300, 400, 500, 600, and 700.
* **Y-axis:** Labeled "MER Average", ranging from approximately 0.06 to 0.16, with tick marks at 0.06, 0.08, 0.10, 0.12, 0.14, and 0.16.
* **Legend:** Located in the top-right corner of the chart. It identifies each line with the following labels and corresponding colors:
* CUSUM (Blue)
* m^(1),L=1 (Orange)
* m^(2),L=1 (Green)
* m^(1),L=5 (Red)
* m^(1),L=10 (Purple)
### Detailed Analysis
Here's a breakdown of each line's trend and approximate data points, verified against the legend colors:
* **CUSUM (Blue):** The line starts at approximately (100, 0.13), decreases to around (200, 0.07), fluctuates between approximately 0.06 and 0.08 until around (600, 0.08), and then increases slightly to approximately (700, 0.09).
* **m^(1),L=1 (Orange):** This line exhibits a steep decline from approximately (100, 0.17) to around (200, 0.09), then continues to decrease, reaching a minimum of approximately (600, 0.05), and slightly increases to approximately (700, 0.06).
* **m^(2),L=1 (Green):** The line starts at approximately (100, 0.14), decreases to around (200, 0.08), and then fluctuates between approximately 0.06 and 0.07, ending at approximately (700, 0.06).
* **m^(1),L=5 (Red):** The line begins at approximately (100, 0.08), decreases to around (200, 0.07), and then fluctuates between approximately 0.05 and 0.06, ending at approximately (700, 0.05).
* **m^(1),L=10 (Purple):** The line starts at approximately (100, 0.07), decreases to around (200, 0.06), and then fluctuates between approximately 0.05 and 0.06, ending at approximately (700, 0.06).
### Key Observations
* The algorithm m^(1),L=1 (orange) shows the most significant initial decrease in MER Average as N increases.
* The algorithms m^(1),L=5 (red) and m^(1),L=10 (purple) consistently exhibit the lowest MER Average values across the range of N.
* CUSUM (blue) has a relatively stable MER Average after the initial decrease.
* m^(2),L=1 (green) shows a moderate decrease in MER Average, but remains higher than m^(1),L=5 and m^(1),L=10.
### Interpretation
The chart suggests that the algorithms m^(1),L=5 and m^(1),L=10 are the most effective in minimizing the Mean Error Rate, particularly as the sample size (N) increases. The algorithm m^(1),L=1 demonstrates a rapid initial improvement but plateaus at a higher MER Average compared to the other two. CUSUM shows a moderate performance, while m^(2),L=1 performs relatively worse.
The parameter 'L' appears to play a crucial role in the performance of the m^(1) algorithm, with larger values of L (5 and 10) leading to lower MER Averages. This could indicate that a larger 'L' value allows for more accurate error detection or a more stable estimation process. The initial steep decline in MER Average for all algorithms suggests that increasing the sample size initially provides significant benefits in reducing error rates. However, beyond a certain point, the improvements diminish, and the algorithms converge towards a stable MER Average. The differences between the algorithms become less pronounced at higher values of N.