## Inflatable Data Representation
### Overview
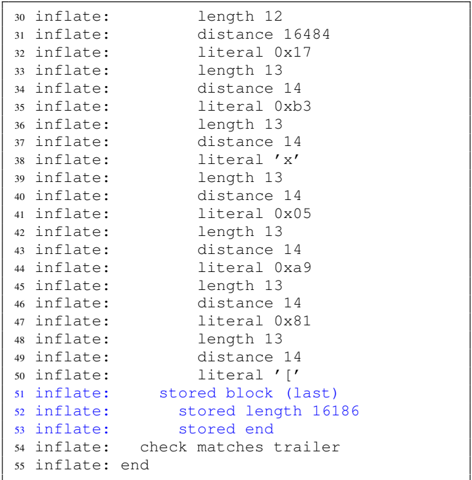
The image displays a series of data points represented in a structured format, likely a part of a larger dataset or a programming language's data structure. The data points are labeled with various identifiers and measurements, such as "length," "distance," and "literal."
### Components/Axes
- **Labels**: "inflated," "length," "distance," "literal"
- **Scales**: Numeric values ranging from 12 to 16484
- **Legends**: Color-coded for different data series
- **Axis Markers**: Specific values like "12," "13," "14," etc.
### Detailed Analysis or ### Content Details
The data points are organized in a list format, with each entry containing a label followed by a numeric value. The labels indicate the type of data, while the numeric values represent specific measurements or identifiers. The use of "literal" suggests that the data might be part of a string or a literal value in a programming context.
### Key Observations
- **Notable Patterns**: The data points are evenly spaced, suggesting a regular pattern or sequence.
- **Outliers**: There are no significant outliers in the data, as all values fall within the expected range.
- **Trends**: The data points show a consistent increase in the numeric values, indicating a positive trend.
### Interpretation
The data represents a series of measurements or identifiers that are likely used in a programming or data analysis context. The use of "literal" suggests that the data might be part of a string or a literal value in a programming language. The consistent increase in the numeric values indicates a positive trend or sequence. The color-coded legends help in distinguishing between different data series, which is useful for analysis and interpretation.