## Line Charts: Model Accuracy Comparison
### Overview
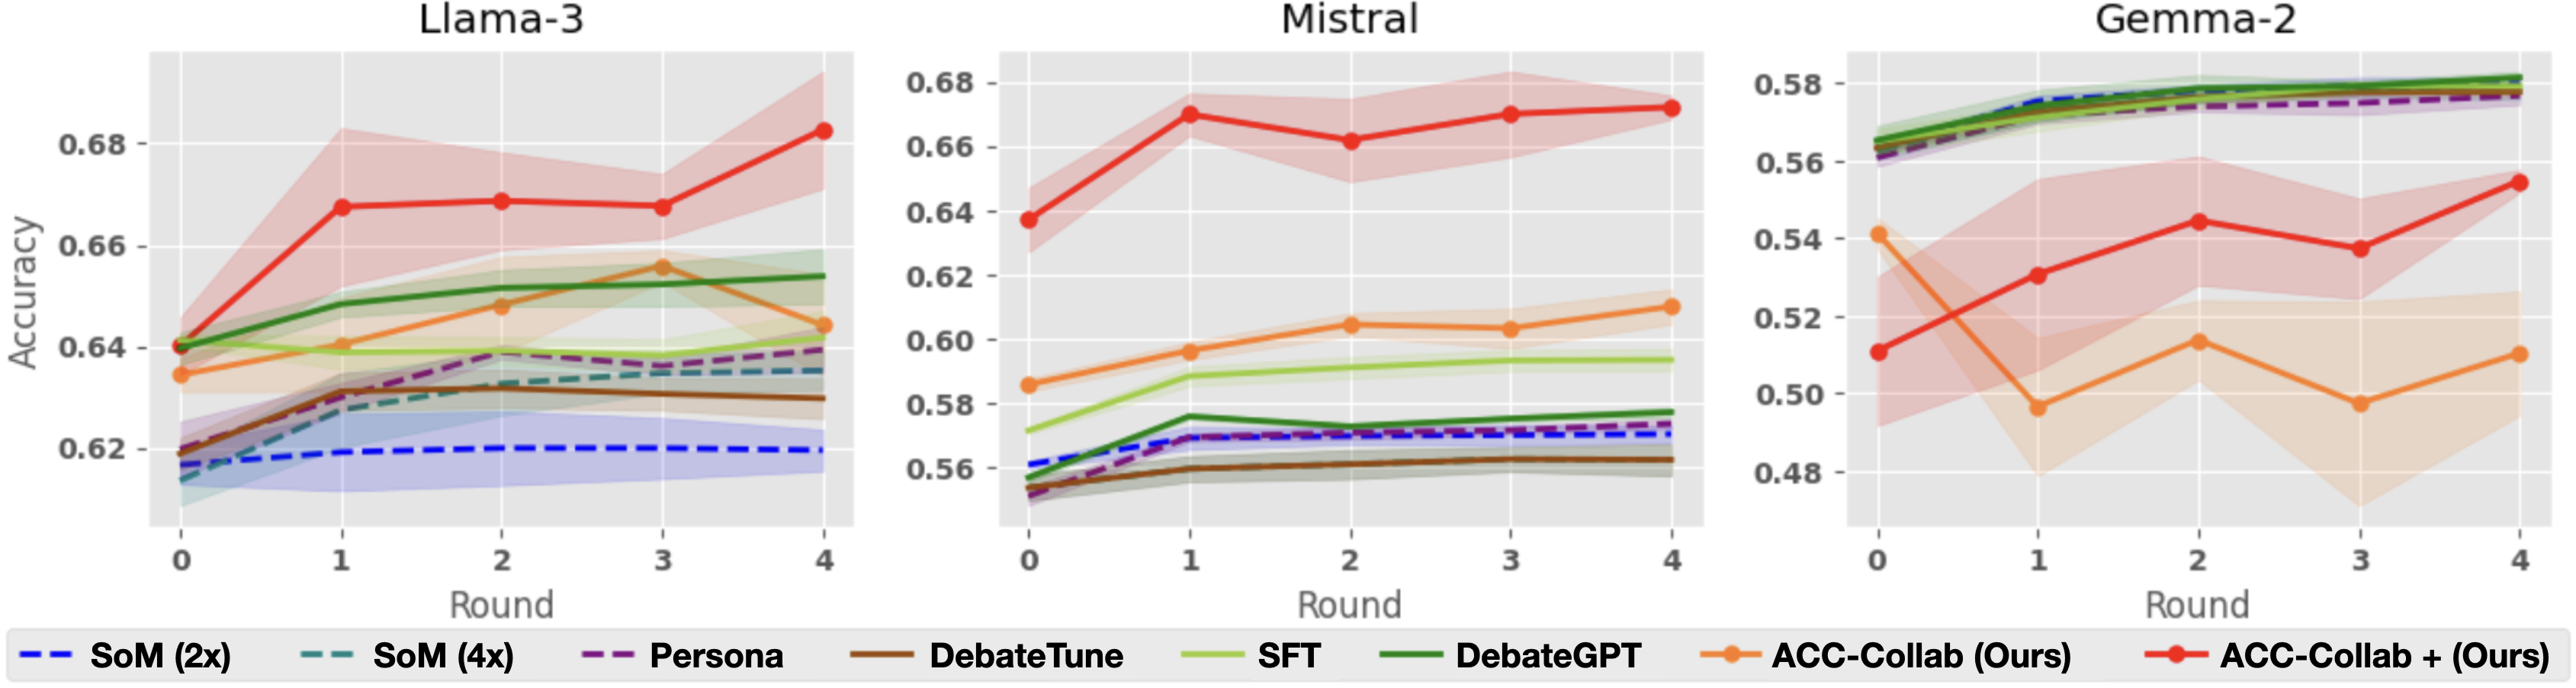
The image presents three line charts comparing the accuracy of different models (Llama-3, Mistral, and Gemma-2) across several rounds of interaction. Each chart displays the performance of various training methods, including SoM (2x), SoM (4x), Persona, DebateTune, SFT, DebateGPT, ACC-Collab (Ours), and ACC-Collab + (Ours). The x-axis represents the round number (0 to 4), and the y-axis represents the accuracy, ranging from approximately 0.62 to 0.68 for Llama-3 and Mistral, and from 0.48 to 0.58 for Gemma-2. Each line represents a different training method, with shaded areas indicating the confidence interval or variability in the accuracy.
### Components/Axes
* **Titles:**
* Top-Left Chart: "Llama-3"
* Top-Middle Chart: "Mistral"
* Top-Right Chart: "Gemma-2"
* **X-Axis:**
* Label: "Round"
* Scale: 0, 1, 2, 3, 4
* **Y-Axis:**
* Label: "Accuracy"
* Left Chart Scale: 0.62, 0.64, 0.66, 0.68
* Middle Chart Scale: 0.56, 0.58, 0.60, 0.62, 0.64, 0.66, 0.68
* Right Chart Scale: 0.48, 0.50, 0.52, 0.54, 0.56, 0.58
* **Legend:** Located at the bottom of the image.
* Blue Dashed Line: "SoM (2x)"
* Teal Dashed Line: "SoM (4x)"
* Purple Dashed Line: "Persona"
* Brown Solid Line: "DebateTune"
* Light Green Solid Line: "SFT"
* Dark Green Solid Line: "DebateGPT"
* Orange Solid Line: "ACC-Collab (Ours)"
* Red Solid Line: "ACC-Collab + (Ours)"
### Detailed Analysis
**Llama-3 Chart:**
* **SoM (2x) (Blue Dashed):** Starts at approximately 0.61 and increases slightly to around 0.62, remaining relatively flat.
* **SoM (4x) (Teal Dashed):** Starts at approximately 0.61 and increases slightly to around 0.64, remaining relatively flat.
* **Persona (Purple Dashed):** Starts at approximately 0.62 and increases slightly to around 0.64, remaining relatively flat.
* **DebateTune (Brown Solid):** Starts at approximately 0.62 and increases slightly to around 0.63, remaining relatively flat.
* **SFT (Light Green Solid):** Starts at approximately 0.58 and increases to approximately 0.65 by round 3, then decreases slightly to around 0.64 by round 4.
* **DebateGPT (Dark Green Solid):** Starts at approximately 0.64 and increases to approximately 0.65 by round 3, then decreases slightly to around 0.64 by round 4.
* **ACC-Collab (Ours) (Orange Solid):** Starts at approximately 0.63 and increases to approximately 0.65 by round 3, then decreases slightly to around 0.64 by round 4.
* **ACC-Collab + (Ours) (Red Solid):** Starts at approximately 0.64 and increases to approximately 0.67 by round 1, then increases to approximately 0.67 by round 2, then increases to approximately 0.67 by round 3, then increases to approximately 0.68 by round 4.
**Mistral Chart:**
* **SoM (2x) (Blue Dashed):** Starts at approximately 0.56 and increases slightly to around 0.57, remaining relatively flat.
* **SoM (4x) (Teal Dashed):** Starts at approximately 0.55 and increases slightly to around 0.57, remaining relatively flat.
* **Persona (Purple Dashed):** Starts at approximately 0.55 and increases slightly to around 0.57, remaining relatively flat.
* **DebateTune (Brown Solid):** Starts at approximately 0.55 and increases slightly to around 0.57, remaining relatively flat.
* **SFT (Light Green Solid):** Starts at approximately 0.58 and increases to approximately 0.60 by round 1, then decreases slightly to around 0.59 by round 4.
* **DebateGPT (Dark Green Solid):** Starts at approximately 0.57 and increases to approximately 0.58 by round 1, then decreases slightly to around 0.57 by round 4.
* **ACC-Collab (Ours) (Orange Solid):** Starts at approximately 0.59 and increases to approximately 0.61 by round 1, then increases to approximately 0.60 by round 3, then increases to approximately 0.61 by round 4.
* **ACC-Collab + (Ours) (Red Solid):** Starts at approximately 0.64 and increases to approximately 0.67 by round 1, then increases to approximately 0.67 by round 2, then increases to approximately 0.67 by round 3, then increases to approximately 0.67 by round 4.
**Gemma-2 Chart:**
* **SoM (2x) (Blue Dashed):** Starts at approximately 0.57 and increases slightly to around 0.58, remaining relatively flat.
* **SoM (4x) (Teal Dashed):** Starts at approximately 0.55 and increases slightly to around 0.57, remaining relatively flat.
* **Persona (Purple Dashed):** Starts at approximately 0.55 and increases slightly to around 0.57, remaining relatively flat.
* **DebateTune (Brown Solid):** Starts at approximately 0.55 and increases slightly to around 0.57, remaining relatively flat.
* **SFT (Light Green Solid):** Starts at approximately 0.57 and increases to approximately 0.57 by round 1, then increases to approximately 0.57 by round 4.
* **DebateGPT (Dark Green Solid):** Starts at approximately 0.57 and increases to approximately 0.57 by round 1, then increases to approximately 0.57 by round 4.
* **ACC-Collab (Ours) (Orange Solid):** Starts at approximately 0.54 and decreases to approximately 0.50 by round 1, then decreases to approximately 0.50 by round 3, then increases to approximately 0.51 by round 4.
* **ACC-Collab + (Ours) (Red Solid):** Starts at approximately 0.51 and increases to approximately 0.54 by round 1, then decreases to approximately 0.54 by round 2, then decreases to approximately 0.54 by round 3, then increases to approximately 0.55 by round 4.
### Key Observations
* **ACC-Collab + (Ours) (Red Solid):** Consistently shows the highest accuracy across all three models (Llama-3, Mistral, and Gemma-2).
* **SoM (2x) (Blue Dashed), SoM (4x) (Teal Dashed), Persona (Purple Dashed), and DebateTune (Brown Solid):** Generally exhibit lower and relatively stable accuracy across all rounds and models.
* **SFT (Light Green Solid) and DebateGPT (Dark Green Solid):** Show moderate performance, with some variation across different models.
* **ACC-Collab (Ours) (Orange Solid):** Shows variable performance, with a noticeable dip in accuracy for Gemma-2.
### Interpretation
The charts provide a comparative analysis of different training methods applied to three language models (Llama-3, Mistral, and Gemma-2). The "ACC-Collab + (Ours)" method consistently outperforms other methods, suggesting it is the most effective in improving model accuracy across different architectures. The relatively flat performance of "SoM (2x)", "SoM (4x)", "Persona", and "DebateTune" indicates that these methods may not be as effective in enhancing accuracy for these models. The variability in "ACC-Collab (Ours)" performance, particularly the dip in accuracy for Gemma-2, suggests that its effectiveness may be model-dependent. Overall, the data suggests that the choice of training method significantly impacts the final accuracy of the language model, with "ACC-Collab + (Ours)" being a promising approach.