## Line Graph: I-Don't-Know Rate Across Llama-3 Model Sizes and Anchoring Methods
### Overview
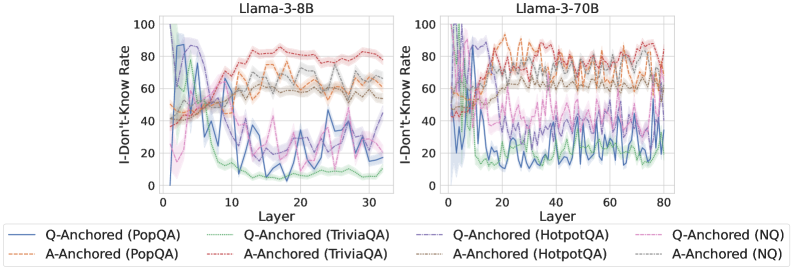
The image contains two line graphs comparing the "I-Don't-Know Rate" (percentage of unanswered questions) across layers of two Llama-3 language models: Llama-3-8B (left) and Llama-3-70B (right). Each graph shows six data series representing different question datasets (PopQA, TriviaQA, HotpotQA, NQ) and anchoring methods (Q-Anchored vs. A-Anchored). The graphs reveal layer-dependent performance variations, with notable fluctuations in higher layers for the 70B model.
### Components/Axes
- **X-axis**: Layer (0–30 for Llama-3-8B, 0–80 for Llama-3-70B)
- **Y-axis**: I-Don't-Know Rate (%) (0–100)
- **Legend**:
- Solid lines: Q-Anchored (PopQA, TriviaQA, HotpotQA, NQ)
- Dashed lines: A-Anchored (PopQA, TriviaQA, HotpotQA, NQ)
- **Color coding**:
- Blue: PopQA
- Green: TriviaQA
- Purple: HotpotQA
- Red: NQ
### Detailed Analysis
#### Llama-3-8B (Left Chart)
- **Q-Anchored (PopQA)**: Starts at ~90% at layer 0, drops sharply to ~40% by layer 10, then fluctuates between 30–60%.
- **A-Anchored (PopQA)**: Begins at ~40%, rises to ~60% by layer 10, then stabilizes near 50–70%.
- **Q-Anchored (TriviaQA)**: Peaks at ~80% at layer 0, declines to ~30% by layer 20, with erratic mid-range fluctuations.
- **A-Anchored (TriviaQA)**: Starts at ~50%, dips to ~20% by layer 10, then rises to ~60% by layer 30.
- **Q-Anchored (HotpotQA)**: Begins at ~70%, drops to ~20% by layer 10, then oscillates between 10–50%.
- **A-Anchored (HotpotQA)**: Starts at ~30%, rises to ~50% by layer 10, then stabilizes near 40–60%.
- **Q-Anchored (NQ)**: Peaks at ~85% at layer 0, declines to ~30% by layer 20, with sharp mid-layer dips.
- **A-Anchored (NQ)**: Starts at ~40%, rises to ~70% by layer 10, then fluctuates between 50–80%.
#### Llama-3-70B (Right Chart)
- **Q-Anchored (PopQA)**: Starts at ~80%, drops to ~30% by layer 20, then fluctuates between 20–60%.
- **A-Anchored (PopQA)**: Begins at ~50%, rises to ~70% by layer 40, then stabilizes near 60–80%.
- **Q-Anchored (TriviaQA)**: Peaks at ~90% at layer 0, declines to ~20% by layer 60, with erratic mid-range fluctuations.
- **A-Anchored (TriviaQA)**: Starts at ~40%, dips to ~10% by layer 20, then rises to ~70% by layer 80.
- **Q-Anchored (HotpotQA)**: Begins at ~60%, drops to ~10% by layer 40, then oscillates between 5–50%.
- **A-Anchored (HotpotQA)**: Starts at ~20%, rises to ~50% by layer 40, then stabilizes near 40–60%.
- **Q-Anchored (NQ)**: Peaks at ~95% at layer 0, declines to ~20% by layer 80, with sharp mid-layer dips.
- **A-Anchored (NQ)**: Starts at ~30%, rises to ~80% by layer 60, then fluctuates between 60–90%.
### Key Observations
1. **Model Size Impact**: The 70B model exhibits more pronounced fluctuations in higher layers (e.g., layer 60–80) compared to the 8B model.
2. **Anchoring Method Differences**:
- Q-Anchored methods generally show higher initial I-Don't-Know rates but sharper declines.
- A-Anchored methods maintain more stable or increasing rates in later layers.
3. **Dataset Variability**:
- NQ (Natural Questions) consistently shows the highest initial I-Don't-Know rates.
- HotpotQA (HotpotQA) demonstrates the most erratic behavior in the 70B model.
4. **Layer-Specific Trends**:
- In Llama-3-8B, layer 10–20 shows critical performance shifts for most datasets.
- In Llama-3-70B, layer 40–60 exhibits significant divergence between anchoring methods.
### Interpretation
The data suggests that anchoring methods (Q vs. A) differentially affect model performance across layers and model sizes. Q-Anchored methods may prioritize early-layer accuracy at the cost of later-layer robustness, while A-Anchored methods appear more consistent in higher layers. The 70B model’s increased volatility in later layers could indicate greater sensitivity to architectural complexity or dataset-specific challenges. Notably, the NQ dataset’s extreme initial I-Don't-Know rates (up to 95%) highlight its role as a particularly challenging benchmark. These trends may reflect trade-offs between model capacity, question complexity, and anchoring strategy design.