## Chart: I-Don't-Know Rate vs. Layer for Llama-3 Models
### Overview
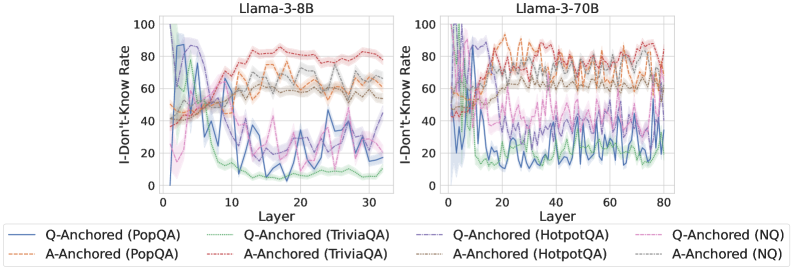
The image presents two line charts comparing the "I-Don't-Know Rate" across different layers of two Llama-3 models: Llama-3-8B and Llama-3-70B. The charts display the rate for different question-answering datasets (PopQA, TriviaQA, HotpotQA, and NQ) and anchoring methods (Q-Anchored and A-Anchored).
### Components/Axes
* **X-axis:** "Layer" - ranging from 0 to 30 for Llama-3-8B and 0 to 80 for Llama-3-70B.
* **Y-axis:** "I-Don't-Know Rate" - ranging from 0 to 100.
* **Models:** Two separate charts, one for "Llama-3-8B" (left) and one for "Llama-3-70B" (right).
* **Datasets/Anchoring:** The legend at the bottom identifies eight data series:
* Q-Anchored (PopQA) - Blue line
* A-Anchored (PopQA) - Orange line
* Q-Anchored (TriviaQA) - Purple line
* A-Anchored (TriviaQA) - Brown line
* Q-Anchored (HotpotQA) - Light Blue dashed line
* A-Anchored (HotpotQA) - Grey dashed line
* Q-Anchored (NQ) - Green line
* A-Anchored (NQ) - Red line
### Detailed Analysis or Content Details
**Llama-3-8B (Left Chart)**
* **Q-Anchored (PopQA):** Starts at approximately 95, rapidly decreases to around 15 by layer 10, then fluctuates between 10 and 25 until layer 30.
* **A-Anchored (PopQA):** Starts at approximately 90, decreases to around 60 by layer 10, and remains relatively stable between 55 and 70 until layer 30.
* **Q-Anchored (TriviaQA):** Starts at approximately 90, decreases to around 20 by layer 10, then fluctuates between 15 and 30 until layer 30.
* **A-Anchored (TriviaQA):** Starts at approximately 85, decreases to around 65 by layer 10, and remains relatively stable between 60 and 75 until layer 30.
* **Q-Anchored (HotpotQA):** Starts at approximately 95, decreases to around 30 by layer 10, then fluctuates between 20 and 40 until layer 30.
* **A-Anchored (HotpotQA):** Starts at approximately 90, decreases to around 50 by layer 10, and remains relatively stable between 45 and 60 until layer 30.
* **Q-Anchored (NQ):** Starts at approximately 95, decreases to around 10 by layer 10, then fluctuates between 5 and 20 until layer 30.
* **A-Anchored (NQ):** Starts at approximately 90, decreases to around 60 by layer 10, and remains relatively stable between 55 and 70 until layer 30.
**Llama-3-70B (Right Chart)**
* **Q-Anchored (PopQA):** Starts at approximately 95, decreases to around 20 by layer 20, then fluctuates between 20 and 40 until layer 80.
* **A-Anchored (PopQA):** Starts at approximately 90, decreases to around 60 by layer 20, and remains relatively stable between 55 and 70 until layer 80.
* **Q-Anchored (TriviaQA):** Starts at approximately 90, decreases to around 25 by layer 20, then fluctuates between 25 and 40 until layer 80.
* **A-Anchored (TriviaQA):** Starts at approximately 85, decreases to around 65 by layer 20, and remains relatively stable between 60 and 75 until layer 80.
* **Q-Anchored (HotpotQA):** Starts at approximately 95, decreases to around 35 by layer 20, then fluctuates between 30 and 50 until layer 80.
* **A-Anchored (HotpotQA):** Starts at approximately 90, decreases to around 55 by layer 20, and remains relatively stable between 50 and 65 until layer 80.
* **Q-Anchored (NQ):** Starts at approximately 95, decreases to around 15 by layer 20, then fluctuates between 10 and 30 until layer 80.
* **A-Anchored (NQ):** Starts at approximately 90, decreases to around 60 by layer 20, and remains relatively stable between 55 and 70 until layer 80.
### Key Observations
* All data series exhibit a significant decrease in "I-Don't-Know Rate" in the initial layers (0-10).
* The Q-Anchored series generally have lower "I-Don't-Know Rates" than the A-Anchored series across all datasets.
* The "I-Don't-Know Rate" stabilizes after approximately layer 20 for Llama-3-8B and layer 20 for Llama-3-70B.
* The 70B model generally exhibits a lower "I-Don't-Know Rate" than the 8B model, especially after the initial decrease.
* PopQA and NQ datasets show the most significant reduction in "I-Don't-Know Rate" with increasing layers.
### Interpretation
The charts demonstrate that as the model layers increase, the "I-Don't-Know Rate" decreases, indicating that the model becomes more confident in its answers. The difference between Q-Anchored and A-Anchored suggests that using question-based anchoring leads to lower uncertainty compared to answer-based anchoring. The larger model (70B) consistently outperforms the smaller model (8B), suggesting that increased model size improves knowledge retention and reduces uncertainty. The stabilization of the "I-Don't-Know Rate" after a certain number of layers indicates that adding more layers beyond that point may not significantly improve performance. The varying rates across datasets suggest that the model's performance is influenced by the complexity and nature of the questions in each dataset. The initial high rates suggest the model starts with limited knowledge and learns as it processes more layers. The consistent trend across both models suggests a general pattern in how these Llama-3 models learn and respond to different types of questions.