## Line Graphs: Direct vs. Belief-based Prediction Accuracy
### Overview
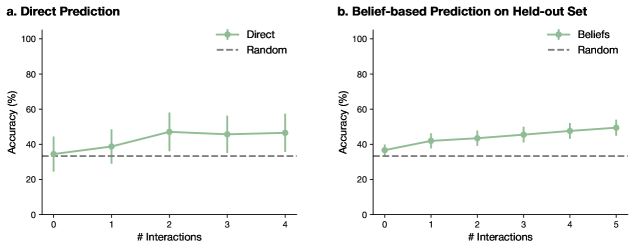
The image contains two line graphs comparing the accuracy of two prediction methods ("Direct Prediction" and "Belief-based Prediction") against a random baseline. Both graphs plot accuracy (%) on the y-axis against the number of interactions (# Interactions) on the x-axis. The graphs are labeled **a. Direct Prediction** (left) and **b. Belief-based Prediction on Held-out Set** (right). Error bars indicate variability in measurements.
---
### Components/Axes
- **X-axis (Horizontal):**
- **Graph a:** # Interactions (0 to 4, integer steps).
- **Graph b:** # Interactions (0 to 5, integer steps).
- Label: "# Interactions" in bold black text.
- **Y-axis (Vertical):**
- Accuracy (%) ranging from 0 to 100 in 20% increments.
- Label: "Accuracy (%)" in bold black text.
- **Legends:**
- **Top-right corner** of both graphs.
- **Direct Prediction:** Green line with circular markers (solid line).
- **Random:** Dashed gray line.
- **Error Bars:**
- Vertical lines extending from data points in both graphs, indicating measurement variability.
---
### Detailed Analysis
#### Graph a: Direct Prediction
- **Trend:**
- The green line (Direct) starts at ~35% accuracy at 0 interactions, rises to ~45% at 1 interaction, peaks at ~50% at 2 interactions, then slightly declines to ~48% at 3 and 4 interactions.
- The dashed gray line (Random) remains flat at ~30% across all interactions.
- **Data Points:**
- 0 interactions: ~35% (Direct), ~30% (Random).
- 1 interaction: ~45% (Direct), ~30% (Random).
- 2 interactions: ~50% (Direct), ~30% (Random).
- 3 interactions: ~48% (Direct), ~30% (Random).
- 4 interactions: ~48% (Direct), ~30% (Random).
#### Graph b: Belief-based Prediction on Held-out Set
- **Trend:**
- The green line (Beliefs) starts at ~40% accuracy at 0 interactions and increases steadily to ~50% at 5 interactions.
- The dashed gray line (Random) remains flat at ~30% across all interactions.
- **Data Points:**
- 0 interactions: ~40% (Beliefs), ~30% (Random).
- 1 interaction: ~42% (Beliefs), ~30% (Random).
- 2 interactions: ~44% (Beliefs), ~30% (Random).
- 3 interactions: ~46% (Beliefs), ~30% (Random).
- 4 interactions: ~48% (Beliefs), ~30% (Random).
- 5 interactions: ~50% (Beliefs), ~30% (Random).
---
### Key Observations
1. **Performance vs. Random Baseline:**
- Both methods consistently outperform the random baseline (~30%) across all interaction counts.
2. **Direct Prediction (Graph a):**
- Shows an initial improvement with interactions but plateaus and slightly declines after 2 interactions.
- Higher variability (larger error bars) compared to Belief-based Prediction.
3. **Belief-based Prediction (Graph b):**
- Demonstrates a steady, linear improvement with increasing interactions.
- Lower variability (smaller error bars) than Direct Prediction.
---
### Interpretation
- **Belief-based Prediction** appears more robust and reliable, as its accuracy improves monotonically with interactions and exhibits less variability. This suggests that incorporating belief-based reasoning enhances generalization over time.
- **Direct Prediction** shows diminishing returns after 2 interactions, with a slight decline at higher interaction counts. This could indicate overfitting or sensitivity to noise in the data.
- The **Random baseline** serves as a control, confirming that both methods provide meaningful improvements beyond chance performance.
- Error bars highlight that Direct Prediction’s results are less consistent, possibly due to higher sensitivity to input variations or model instability.
The data underscores the advantages of belief-based approaches in dynamic prediction tasks, particularly when interactions increase.