## Chart: Accuracy vs. Number of Interactions for Direct and Belief-based Predictions
### Overview
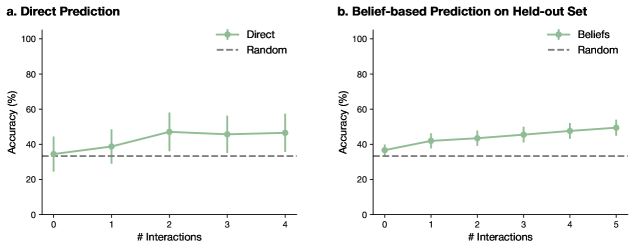
The image presents two line graphs comparing the accuracy of "Direct Prediction" and "Belief-based Prediction on Held-out Set" against the number of interactions. Both graphs also show a "Random" baseline for comparison. The y-axis represents accuracy in percentage, and the x-axis represents the number of interactions. Error bars are present on the data points.
### Components/Axes
**Left Chart (a. Direct Prediction):**
* **Title:** a. Direct Prediction
* **Y-axis:** Accuracy (%) with scale from 0 to 100 in increments of 20.
* **X-axis:** # Interactions, ranging from 0 to 4 in increments of 1.
* **Legend (Top-Right):**
* Direct (Light Green Line with Circle Markers)
* Random (Dashed Gray Line)
**Right Chart (b. Belief-based Prediction on Held-out Set):**
* **Title:** b. Belief-based Prediction on Held-out Set
* **Y-axis:** Accuracy (%) with scale from 0 to 100 in increments of 20.
* **X-axis:** # Interactions, ranging from 0 to 5 in increments of 1.
* **Legend (Top-Right):**
* Beliefs (Light Green Line with Circle Markers)
* Random (Dashed Gray Line)
### Detailed Analysis
**Left Chart (Direct Prediction):**
* **Direct (Light Green Line):**
* Trend: Initially increases, then plateaus.
* Data Points:
* 0 Interactions: Accuracy ~35%
* 1 Interaction: Accuracy ~40%
* 2 Interactions: Accuracy ~47%
* 3 Interactions: Accuracy ~47%
* 4 Interactions: Accuracy ~47%
* **Random (Dashed Gray Line):**
* Constant at ~33%
**Right Chart (Belief-based Prediction):**
* **Beliefs (Light Green Line):**
* Trend: Gradually increases.
* Data Points:
* 0 Interactions: Accuracy ~38%
* 1 Interaction: Accuracy ~43%
* 2 Interactions: Accuracy ~46%
* 3 Interactions: Accuracy ~47%
* 4 Interactions: Accuracy ~49%
* 5 Interactions: Accuracy ~50%
* **Random (Dashed Gray Line):**
* Constant at ~33%
### Key Observations
* Both "Direct" and "Beliefs" predictions start above the "Random" baseline.
* "Direct Prediction" shows an initial increase in accuracy but plateaus after 2 interactions.
* "Belief-based Prediction" shows a more gradual and consistent increase in accuracy with increasing interactions.
* Error bars are present on all data points, indicating variability in the results.
### Interpretation
The data suggests that both direct and belief-based prediction methods perform better than random chance. The direct prediction method shows an initial improvement in accuracy with a few interactions, but its performance plateaus quickly. In contrast, the belief-based prediction method demonstrates a more consistent and gradual improvement in accuracy as the number of interactions increases. This could indicate that belief-based methods are better at leveraging additional interactions to refine their predictions, while direct prediction methods may reach a performance limit more quickly. The error bars indicate that there is some variability in the results, which should be considered when interpreting the findings.