## Diagram: Neural Network Architecture and Encoding Representation
### Overview
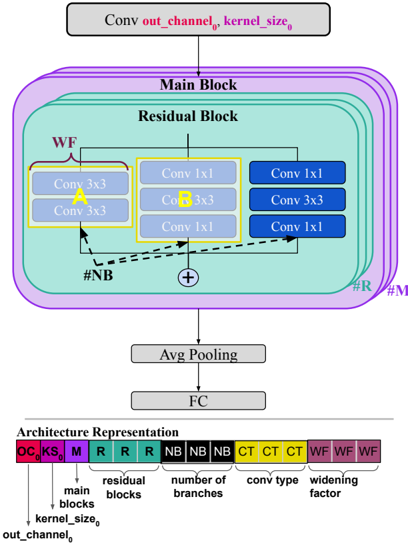
The image displays a hierarchical neural network architecture diagram, specifically focusing on a "Residual Block" nested within a "Main Block." Below the network architecture, there is a schematic labeled "Architecture Representation," which serves as a color-coded encoding vector (or genotype) used to define the hyperparameters of the network structure.
### Components/Axes
The diagram is organized vertically into three distinct sections:
1. **Top Section:** Input Convolution layer.
2. **Middle Section (Main Architecture):** A nested block structure containing the Residual Block and its internal branches, followed by pooling and fully connected layers.
3. **Bottom Section (Architecture Representation):** A color-coded array representing the network's hyperparameters.
### Detailed Analysis
#### 1. Network Architecture (Middle Section)
* **Top Input:** A gray box labeled "Conv out_channel_0, kernel_size_0".
* **Main Block (Purple):** A large, rounded rectangle containing multiple stacked layers. At the bottom right, it is labeled "#M" (likely representing the number of Main Blocks).
* **Residual Block (Teal):** Nested inside the Main Block. At the bottom right, it is labeled "#R" (likely representing the number of Residual Blocks).
* **Internal Branches:** The Residual Block contains three parallel vertical branches:
* **Left Branch (Yellow Box, labeled "WF"):** Contains two stacked "Conv 3x3" layers.
* **Middle Branch (Yellow Box, labeled "B"):** Contains three stacked layers: "Conv 1x1", "Conv 3x3", "Conv 1x1".
* **Right Branch (Dark Blue):** Contains three stacked layers: "Conv 1x1", "Conv 3x3", "Conv 1x1".
* **Flow/Connections:**
* A summation symbol ($\oplus$) is located at the bottom of the Residual Block, indicating the aggregation of the branches.
* Dashed arrows labeled "#NB" (Number of Branches) point from the bottom of the Residual Block to the inputs of the three branches.
* **Post-Processing:** Below the Main Block, there are two gray boxes: "Avg Pooling" and "FC" (Fully Connected).
#### 2. Architecture Representation (Bottom Section)
This is a horizontal bar composed of colored segments, mapping to specific hyperparameters. The segments are ordered from left to right:
* **Red Segment:** Labeled `OC_0` (maps to `out_channel_0`).
* **Purple Segment:** Labeled `KS_0` (maps to `kernel_size_0`).
* **Purple Segment:** Labeled `M` (maps to `main blocks`).
* **Teal Segments (3):** Labeled `R` (maps to `residual blocks`).
* **Black Segments (3):** Labeled `NB` (maps to `number of branches`).
* **Yellow Segments (3):** Labeled `CT` (maps to `conv type`).
* **Maroon/Brown Segments (3):** Labeled `WF` (maps to `widening factor`).
### Key Observations
* **Color Coding:** The colors in the "Architecture Representation" bar correspond to the colors used in the main diagram (e.g., Teal for Residual Blocks, Yellow for the specific branch types, Purple for Main Blocks).
* **Modular Design:** The diagram illustrates a highly modular network where the number of blocks (`#M`, `#R`) and the internal structure of the residual block (`#NB`, `CT`, `WF`) are parameterized.
* **Encoding Scheme:** The "Architecture Representation" bar acts as a fixed-length vector, suggesting this architecture is designed for optimization algorithms (like Neural Architecture Search or Genetic Algorithms) where the network structure is encoded as a sequence of values.
### Interpretation
This diagram represents a **parameterized neural network search space**.
* **Design Intent:** The structure demonstrates a "Residual Block" that is not static; it allows for variable branch configurations. By changing the values in the "Architecture Representation" vector, one can alter the network's depth (number of blocks), width (widening factor), and connectivity (number of branches/conv types) without changing the fundamental topology.
* **Peircean Investigative View:** The use of dashed arrows labeled "#NB" and the explicit mapping of the "Architecture Representation" bar suggest this is a technical specification for an automated system. The system treats the network architecture as a "genotype" (the bar) that expresses a "phenotype" (the diagram). The "WF" (Widening Factor) and "CT" (Conv Type) labels imply that the system can swap out convolution types (e.g., 1x1 vs 3x3) and scale the width of the layers dynamically.
* **Conclusion:** This is a blueprint for a flexible, scalable CNN architecture, likely used in research contexts where the optimal network configuration is learned rather than manually designed.