## Solar Observation Drawings
### Overview
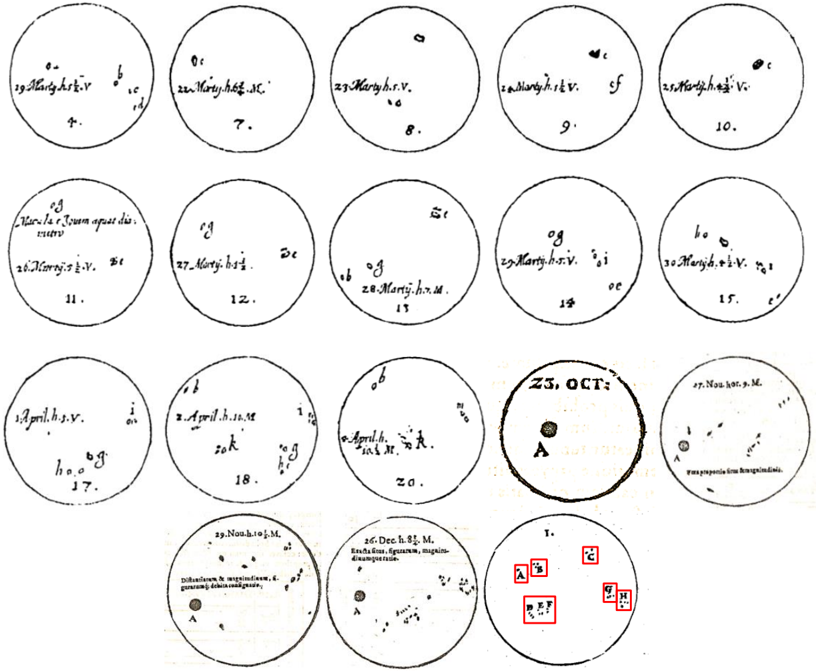
The image presents a collection of hand-drawn diagrams depicting observations of the sun's surface at different dates. Each diagram is a circular representation of the sun, with markings indicating sunspots or other features. The diagrams are arranged in a grid, with dates and times noted alongside each observation.
### Components/Axes
Each circular diagram includes:
* **Date and Time:** Written in abbreviated form (e.g., "29. Marty.h.s.V.").
* **Sunspot Markings:** Small dots or irregular shapes representing sunspots.
* **Reference Letters:** Small letters (e.g., "a", "b", "c") used to identify specific sunspots.
### Detailed Analysis
Here's a breakdown of each diagram, proceeding from left to right, top to bottom:
1. **Diagram 1:** "19. Marty.h.s.V." Sunspots labeled "b", "c", and "d". Positioned in the top-left.
2. **Diagram 2:** "22. Marty.h.s.C." One sunspot visible. Positioned in the top-center.
3. **Diagram 3:** "23. Marty.h.s.V." One sunspot visible. Positioned in the top-right.
4. **Diagram 4:** "24. Marty.h.s.V." Sunspot labeled "f". Positioned in the second row, far-left.
5. **Diagram 5:** "25. Marty.h.s.V." Sunspot labeled "c". Positioned in the second row, center-left.
6. **Diagram 6:** "26. Marty.h.s.V." Text above: "Macula et Jovem aquat dis." Sunspots labeled "st". Positioned in the second row, center.
7. **Diagram 7:** "27. Marty.h.s." Sunspots labeled "og" and "de". Positioned in the second row, center-right.
8. **Diagram 8:** "28. Marty.h.m." Sunspots labeled "og". Positioned in the second row, far-right.
9. **Diagram 9:** "29. Marty.h.s.V." Sunspots labeled "og", "i", and "oe". Positioned in the third row, far-left.
10. **Diagram 10:** "30. Marty.h.s.V." Sunspots labeled "ho" and "e". Positioned in the third row, center-left.
11. **Diagram 11:** "1. April.h.s.V." Sunspots labeled "ho" and "og". Positioned in the third row, center.
12. **Diagram 12:** "2. April.h.s.M." Sunspots labeled "z", "o", and "k". Positioned in the third row, center-right.
13. **Diagram 13:** "4. April.h.s.M." Sunspots labeled "k". Positioned in the third row, far-right.
14. **Diagram 14:** "23. OCT:" A large sunspot labeled "A" is visible. Positioned in the fourth row, center.
15. **Diagram 15:** "27. Nou. hor. 9. M." Several small sunspots are visible. Text below: "transposita item hinc inde". Positioned in the fourth row, right.
16. **Diagram 16:** "29. Nou.h.101.M." Several small sunspots are visible. Text below: "Distantiam & magnitudinem, f. gurarum, debito indicare". Sunspot labeled "A". Positioned in the bottom-left.
17. **Diagram 17:** "26. Dec. h. 84. M." Several small sunspots are visible. Text below: "Exactissima, figurarum, magnitudinem, distantiaeque". Sunspot labeled "A". Positioned in the bottom-center.
18. **Diagram 18:** "1." Several sunspots are visible, labeled with red squares: "A", "B", "C", "D", "E", "F", "G", and "H". Positioned in the bottom-right.
### Key Observations
* The diagrams show variations in the number, size, and position of sunspots over time.
* Some diagrams include additional notes or labels related to the observed features.
* The dates span from March to December, suggesting observations were conducted over a significant portion of the year.
### Interpretation
The collection of drawings represents a historical record of solar observations. The variations in sunspot activity likely reflect the dynamic nature of the sun's surface and its magnetic field. The accompanying notes suggest an attempt to document the position, size, and characteristics of the observed sunspots. The diagrams provide valuable insight into the methods and observations of early solar astronomy. The consistent use of dates and times indicates a systematic approach to data collection.