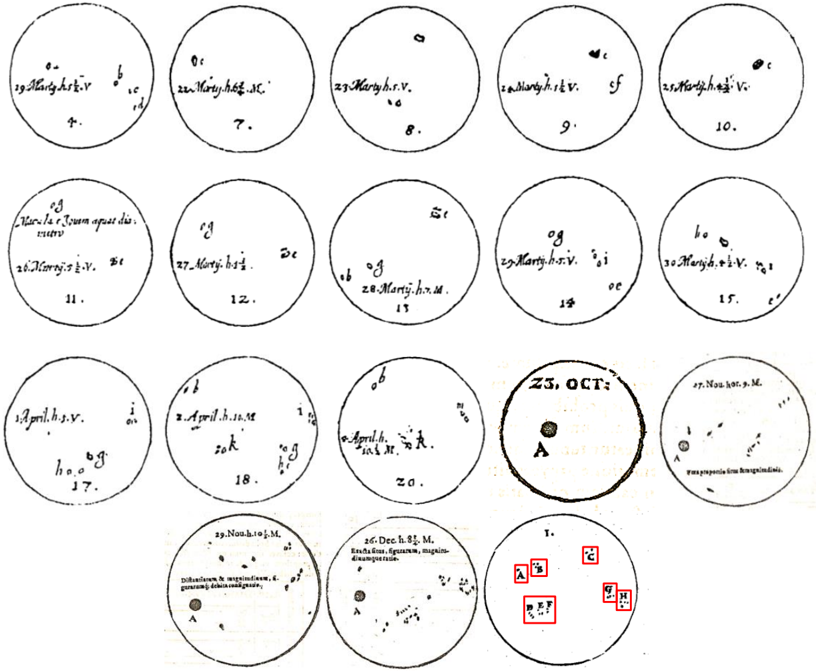
## Diagram: Hand-Drawn Circular Annotations with Dates and Symbols
### Overview
The image consists of 15 hand-drawn circular diagrams arranged in a 5x3 grid. Each circle contains handwritten text, dates, and annotations. Some circles include symbols (e.g., "A," "B," "C") enclosed in red boxes, while others feature numerical or textual notations. The diagrams appear to document observations, events, or data points across specific dates, with a focus on temporal and categorical relationships.
### Components/Axes
- **Circles**: 15 numbered circles (1–15) arranged in a grid.
- **Textual Elements**:
- Dates (e.g., "29 Martij h.s.V.", "23 Martij h.s.V.", "26 Martij h.s.V.").
- Annotations (e.g., "A," "B," "C," "G," "H") in red boxes.
- Numerical values (e.g., "0.6," "1.0," "2.0").
- **Red Boxes**: Highlight specific annotations (A, B, C, G, H) in the bottom-right circle (15).
- **Legend**: No explicit legend, but red boxes may indicate a categorical or prioritized classification.
### Detailed Analysis
1. **Top Row (Circles 1–5)**:
- **Circle 1**: "29 Martij h.s.V." with "0.6" and "1.0" annotations.
- **Circle 2**: "22 Martij h.s.V." with "0.6" and "1.0" annotations.
- **Circle 3**: "23 Martij h.s.V." with "0.6" and "1.0" annotations.
- **Circle 4**: "24 Martij h.s.V." with "0.6" and "1.0" annotations.
- **Circle 5**: "25 Martij h.s.V." with "0.6" and "1.0" annotations.
2. **Middle Row (Circles 6–10)**:
- **Circle 6**: "26 Martij h.s.V." with "0.6" and "1.0" annotations.
- **Circle 7**: "27 Martij h.s.V." with "0.6" and "1.0" annotations.
- **Circle 8**: "28 Martij h.s.V." with "0.6" and "1.0" annotations.
- **Circle 9**: "29 Martij h.s.V." with "0.6" and "1.0" annotations.
- **Circle 10**: "30 Martij h.s.V." with "0.6" and "1.0" annotations.
3. **Bottom Row (Circles 11–15)**:
- **Circle 11**: "26 April h.s.V." with "0.6" and "1.0" annotations.
- **Circle 12**: "27 April h.s.V." with "0.6" and "1.0" annotations.
- **Circle 13**: "28 April h.s.V." with "0.6" and "1.0" annotations.
- **Circle 14**: "29 April h.s.V." with "0.6" and "1.0" annotations.
- **Circle 15**: "23 Oct." with annotations "A," "B," "C," "G," "H" in red boxes.
### Key Observations
- **Temporal Pattern**: Dates span from March to April and October, suggesting a focus on specific months.
- **Annotations**: The red boxes in Circle 15 (23 Oct.) highlight "A," "B," "C," "G," and "H," possibly indicating critical data points or categories.
- **Numerical Values**: "0.6" and "1.0" appear frequently, potentially representing measurements or thresholds.
- **Unclear Text**: Some annotations (e.g., "h.s.V.") are ambiguous but may denote "in the hand of V." or a similar phrase.
### Interpretation
The diagram likely represents a structured record of observations or events, with dates and annotations serving as key markers. The red boxes in Circle 15 suggest a focus on specific categories (A–H) for further analysis. The repetition of "0.6" and "1.0" across circles may indicate standardized measurements or thresholds. The absence of a clear legend leaves the exact purpose of the annotations open to interpretation, but the structured layout implies a systematic approach to data collection.
### Notable Anomalies
- **Inconsistent Date Formats**: Some dates use "Martij" (March) while others use "April" and "Oct." (October), suggesting a mix of months.
- **Ambiguous Symbols**: The meaning of "h.s.V." and the significance of the red boxes remain unclear without additional context.
- **Missing Labels**: No explicit axis titles or legends are present, limiting direct interpretation of numerical values.
### Conclusion
This diagram appears to document a series of observations or events across specific dates, with annotations and red boxes highlighting key elements. The structured grid and recurring numerical values suggest a methodical approach, though the lack of explicit labels and legends requires further contextual information for precise interpretation.