# Technical Document Extraction: Line Graph Analysis
## Title
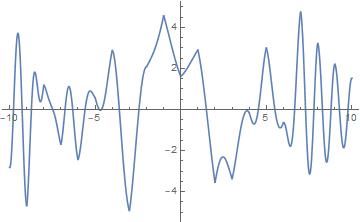
No explicit title provided in the image.
## Axes
- **X-Axis**:
- Range: -10 to 10
- No explicit label or title.
- **Y-Axis**:
- Range: -4 to 4
- No explicit label or title.
## Line Characteristics
- **Color**: Blue
- **Behavior**:
- Oscillatory pattern with alternating peaks and troughs.
- No smooth sinusoidal waveform; irregular amplitude and frequency.
- Key transitions:
- **Increasing**:
- From (-10, -3) to (-8, 3)
- From (-6, -2) to (-4, 3)
- From (-2, -1) to (0, 4)
- From (2, -1) to (4, 4)
- From (6, -2) to (8, 4)
- From (10, -1) to (10, 2)
- **Decreasing**:
- From (-8, 3) to (-6, -2)
- From (-4, 3) to (-2, -1)
- From (0, 4) to (2, -1)
- From (4, 4) to (6, -2)
- From (8, 4) to (10, -1)
- **Local Minima**:
- (-8, -4) [deepest trough]
- (-6, -2)
- (-2, -1)
- (2, -1)
- (6, -2)
- (10, -1)
- **Local Maxima**:
- (-8, 3)
- (-4, 3)
- (0, 4)
- (4, 4)
- (8, 4)
- (10, 2)
## Key Data Points
- **Highest Peak**: (0, 4)
- **Lowest Trough**: (-8, -4)
- **Final Value**: (10, 2)
## Observations
1. The line exhibits **asymmetric oscillations**, with peaks and troughs of varying magnitudes.
2. **Rapid transitions** occur between -10 and -8, and between 8 and 10, suggesting higher frequency in these intervals.
3. No symmetry or periodicity is evident; the waveform is irregular.
4. The line crosses the x-axis multiple times, indicating zero-crossings at unmarked intervals.
## Legend
No legend present in the image.
## Conclusion
The graph represents a complex, non-periodic oscillatory function with no explicit labels or contextual information. Key features include irregular amplitude, asymmetric peaks/troughs, and a final upward trend at x=10.