## Line Chart: Shannon and Bayesian Surprises
### Overview
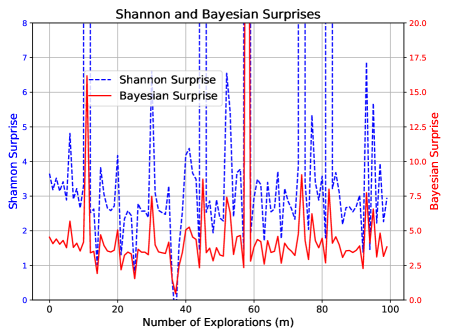
The image is a line chart comparing Shannon Surprise and Bayesian Surprise over a number of explorations (m). The chart displays two data series: Shannon Surprise (represented by a blue dashed line) and Bayesian Surprise (represented by a solid red line). The x-axis represents the number of explorations, ranging from 0 to 100. The left y-axis represents Shannon Surprise, ranging from 0 to 8. The right y-axis represents Bayesian Surprise, ranging from 0 to 20.
### Components/Axes
* **Title:** Shannon and Bayesian Surprises
* **X-axis:**
* Label: Number of Explorations (m)
* Scale: 0 to 100, with tick marks at intervals of 20.
* **Left Y-axis:**
* Label: Shannon Surprise
* Scale: 0 to 8, with tick marks at intervals of 1.
* **Right Y-axis:**
* Label: Bayesian Surprise
* Scale: 0.0 to 20.0, with tick marks at intervals of 2.5.
* **Legend:** Located in the top-left corner of the chart.
* Shannon Surprise: Blue dashed line
* Bayesian Surprise: Red solid line
### Detailed Analysis
* **Shannon Surprise (Blue Dashed Line):**
* Trend: The Shannon Surprise fluctuates significantly throughout the explorations. It starts around 3, rises sharply, then oscillates with several peaks and troughs.
* Data Points:
* At m=0, Shannon Surprise ≈ 3.2
* At m=10, Shannon Surprise ≈ 3.3
* At m=20, Shannon Surprise ≈ 2.5
* At m=40, Shannon Surprise ≈ 0.1
* At m=60, Shannon Surprise ≈ 4.5
* At m=80, Shannon Surprise ≈ 3.0
* At m=100, Shannon Surprise ≈ 2.2
* **Bayesian Surprise (Red Solid Line):**
* Trend: The Bayesian Surprise also fluctuates, but generally stays lower than the Shannon Surprise. It has some sharp peaks, but overall, it remains relatively stable.
* Data Points:
* At m=0, Bayesian Surprise ≈ 4.0
* At m=10, Bayesian Surprise ≈ 4.0
* At m=20, Bayesian Surprise ≈ 3.0
* At m=40, Bayesian Surprise ≈ 1.0
* At m=60, Bayesian Surprise ≈ 5.0
* At m=80, Bayesian Surprise ≈ 3.0
* At m=100, Bayesian Surprise ≈ 3.0
### Key Observations
* The Shannon Surprise exhibits higher volatility compared to the Bayesian Surprise.
* Both surprise metrics show peaks, indicating moments of unexpected information during the explorations.
* There are instances where both metrics spike simultaneously, suggesting shared moments of surprise.
### Interpretation
The chart compares two different measures of surprise (Shannon and Bayesian) during a series of explorations. The Shannon Surprise, based on information theory, quantifies the unexpectedness of an event based on its probability. The Bayesian Surprise, on the other hand, measures the change in belief after observing new data.
The higher volatility of the Shannon Surprise suggests that it is more sensitive to individual unexpected events. The Bayesian Surprise, being a measure of belief change, is smoother and reflects a more cumulative understanding of the environment.
The simultaneous spikes in both metrics indicate significant events that are both unexpected and cause a substantial shift in beliefs. The differences in their magnitudes and patterns suggest that they capture different aspects of surprise, providing a more comprehensive understanding of the exploration process.