## Line Chart: Shannon and Bayesian Surprises
### Overview
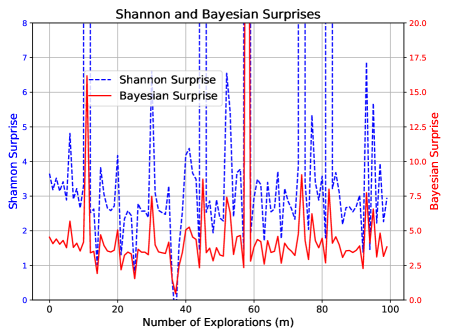
This is a dual-axis line chart comparing two different metrics of "surprise" over a series of explorations. The chart plots "Shannon Surprise" and "Bayesian Surprise" against the "Number of Explorations (m)". The data shows high variability and spiky behavior for both metrics, with notable differences in scale and pattern.
### Components/Axes
* **Title:** "Shannon and Bayesian Surprises" (centered at the top).
* **X-Axis:**
* **Label:** "Number of Explorations (m)"
* **Scale:** Linear, ranging from 0 to 100.
* **Major Ticks:** 0, 20, 40, 60, 80, 100.
* **Primary Y-Axis (Left):**
* **Label:** "Shannon Surprise"
* **Scale:** Linear, ranging from 0 to 8.
* **Major Ticks:** 0, 1, 2, 3, 4, 5, 6, 7, 8.
* **Associated Data Series:** Blue dashed line.
* **Secondary Y-Axis (Right):**
* **Label:** "Bayesian Surprise"
* **Scale:** Linear, ranging from 0.0 to 20.0.
* **Major Ticks:** 0.0, 2.5, 5.0, 7.5, 10.0, 12.5, 15.0, 17.5, 20.0.
* **Associated Data Series:** Red solid line.
* **Legend:**
* **Position:** Top-left corner of the plot area.
* **Items:**
1. Blue dashed line: "Shannon Surprise"
2. Red solid line: "Bayesian Surprise"
### Detailed Analysis
**Data Series Trends:**
1. **Shannon Surprise (Blue Dashed Line):**
* **Trend:** Exhibits high-frequency, high-amplitude oscillations throughout the entire range of explorations. The line frequently spikes to values between 4 and 8 on its axis, with deep troughs often falling below 2.
* **Key Data Points (Approximate):**
* Starts near 3.5 at m=0.
* Major peaks: ~7.5 at m≈12, ~6.5 at m≈45, ~7.8 at m≈58, ~7.5 at m≈75, ~6.8 at m≈95.
* Notable trough: Near 0 at m≈40.
* General baseline appears to fluctuate between 1 and 4.
2. **Bayesian Surprise (Red Solid Line):**
* **Trend:** Also shows spiky behavior but with a different pattern. It has a lower baseline (mostly between 1 and 5 on its axis) punctuated by several very sharp, high-magnitude spikes.
* **Key Data Points (Approximate):**
* Starts near 4.0 at m=0.
* Major spikes: ~16.0 at m≈12, ~19.5 at m≈58 (the highest point), ~15.0 at m≈75, ~12.5 at m≈95.
* Smaller, frequent spikes between 2.5 and 7.5.
* Deepest trough aligns with Shannon's at m≈40, dropping to near 0.
**Cross-Reference & Spatial Grounding:**
* The legend in the top-left correctly maps the blue dashed line to the left axis (Shannon) and the red solid line to the right axis (Bayesian).
* The highest peak for Bayesian Surprise (red, ~19.5) occurs at approximately m=58, which corresponds to a high peak for Shannon Surprise (blue, ~7.8).
* The most significant trough for both series occurs at the same exploration number, m≈40.
### Key Observations
1. **Correlated Spikes:** Major spikes in both metrics often occur at similar exploration numbers (e.g., m≈12, 58, 75, 95), suggesting events that cause high surprise in both information-theoretic and Bayesian frameworks.
2. **Inverse Behavior at m=40:** At approximately 40 explorations, both metrics drop to near-zero simultaneously, indicating a period of minimal surprise or high predictability.
3. **Scale Difference:** Bayesian Surprise operates on a larger numerical scale (0-20) compared to Shannon Surprise (0-8), but its baseline is not proportionally higher; its spikes are more extreme relative to its baseline.
4. **Volatility:** Both signals are highly volatile, with no smooth trends, indicating that the "surprise" associated with each exploration step is highly variable and context-dependent.
### Interpretation
This chart visualizes the difference between two fundamental ways of measuring "surprise" or information gain in a learning or exploration process.
* **Shannon Surprise** (blue) measures the information content or improbability of an outcome based on a known probability distribution. Its constant high variability suggests the outcomes of explorations are frequently improbable according to the current model.
* **Bayesian Surprise** (red) measures how much an outcome causes a revision of beliefs (the divergence between prior and posterior distributions). Its pattern of a low baseline with extreme spikes indicates that most explorations cause only minor belief updates, but occasional explorations are profoundly informative, radically changing the model's understanding.
The correlation of major spikes suggests that outcomes which are highly improbable (high Shannon Surprise) often also force significant belief updates (high Bayesian Surprise). However, the scales and shapes differ because an event can be improbable without changing beliefs much (if it was already considered a low-probability possibility), or it can cause a major belief update even if it wasn't extremely improbable (e.g., confirming a rare but critical hypothesis). The simultaneous drop at m=40 is particularly interesting, representing a "calm" period where outcomes were both expected and non-informative. This dual-axis chart is crucial for understanding the nuanced dynamics of information acquisition during an exploratory process.