\n
## Box Plots: ECE and AUROC Difference Comparison
### Overview
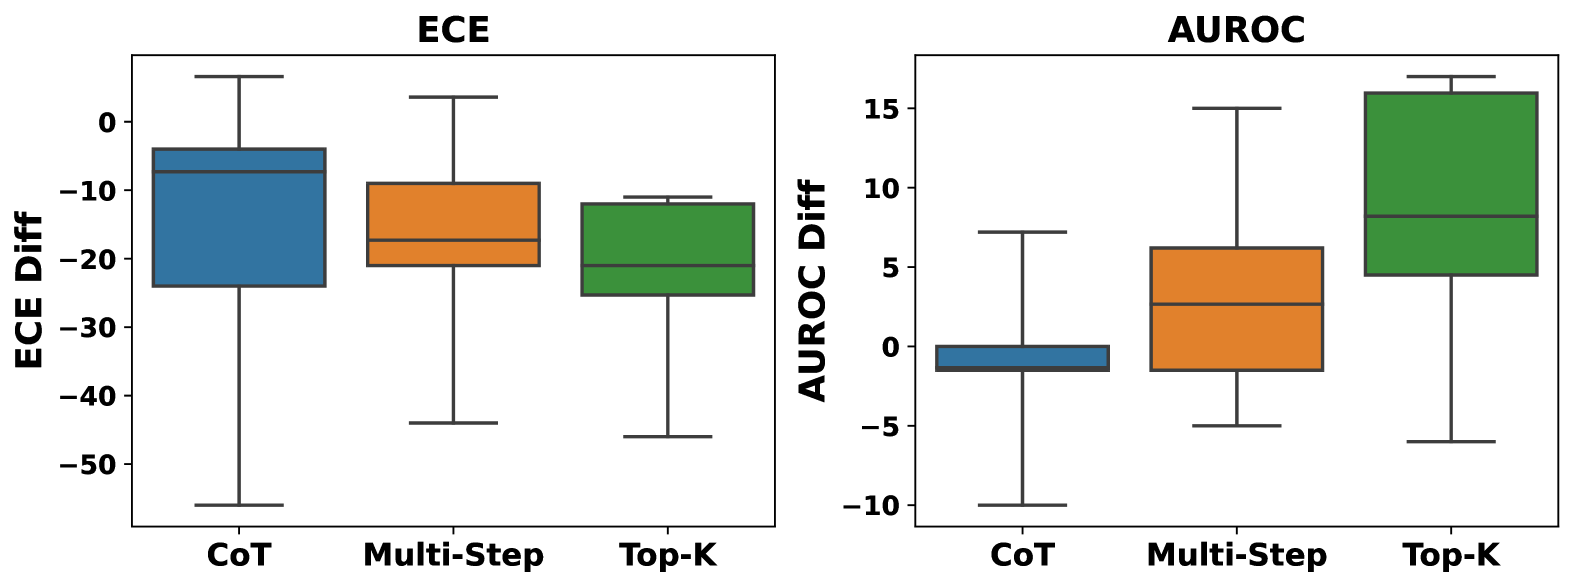
The image presents two box plots side-by-side, comparing the differences in Expected Calibration Error (ECE) and Area Under the Receiver Operating Characteristic curve (AUROC) across three different methods: Chain-of-Thought (CoT), Multi-Step, and Top-K. Each box plot visualizes the distribution of the difference between a baseline and each method.
### Components/Axes
* **X-axis (Both Plots):** Method - CoT, Multi-Step, Top-K.
* **Y-axis (Left Plot):** ECE Diff (approximately ranging from -55 to 5).
* **Y-axis (Right Plot):** AUROC Diff (approximately ranging from -10 to 15).
* **Box Plot Components:** Each box plot displays the median, quartiles (25th and 75th percentiles), and whiskers representing the range of the data, with potential outliers shown as individual points.
* **Colors:**
* CoT: Light Blue
* Multi-Step: Orange/Red
* Top-K: Green
### Detailed Analysis or Content Details
**Left Plot: ECE Difference**
* **CoT (Light Blue):** The median ECE difference is approximately -10. The box extends from roughly -20 to 0. Whiskers extend to approximately -45 and 5.
* **Multi-Step (Orange/Red):** The median ECE difference is approximately -15. The box extends from roughly -25 to -10. Whiskers extend to approximately -50 and 0.
* **Top-K (Green):** The median ECE difference is approximately -10. The box extends from roughly -20 to 0. Whiskers extend to approximately -40 and 5.
**Right Plot: AUROC Difference**
* **CoT (Light Blue):** The median AUROC difference is approximately 0. The box extends from roughly -5 to 5. Whiskers extend to approximately -10 and 10.
* **Multi-Step (Orange/Red):** The median AUROC difference is approximately 2. The box extends from roughly -2 to 7. Whiskers extend to approximately -7 and 12.
* **Top-K (Green):** The median AUROC difference is approximately 12. The box extends from roughly 7 to 15. Whiskers extend to approximately 2 and 18.
### Key Observations
* **ECE:** Both Multi-Step and Top-K show a negative median ECE difference, indicating an improvement over the baseline. CoT also shows a negative median, but less pronounced than Multi-Step.
* **AUROC:** Top-K demonstrates a significantly positive median AUROC difference, suggesting a substantial improvement. Multi-Step shows a modest positive difference, while CoT is close to zero.
* **Variance:** The AUROC differences exhibit more variance than the ECE differences, as indicated by the longer whiskers and larger box sizes.
* **Outliers:** There are some outliers visible in both plots, particularly for the Multi-Step method in the AUROC plot.
### Interpretation
The data suggests that the Multi-Step and Top-K methods generally improve ECE, while Top-K significantly enhances AUROC performance compared to the baseline. CoT shows a slight improvement in ECE but has minimal impact on AUROC. The larger variance in AUROC differences indicates that the performance gains from Top-K and Multi-Step are more sensitive to the specific dataset or conditions. The presence of outliers suggests that there are instances where these methods perform substantially better or worse than the typical trend.
The differences in ECE and AUROC suggest that these methods address different aspects of model calibration and performance. While Multi-Step and Top-K improve the model's confidence in its predictions (ECE), Top-K particularly excels at distinguishing between positive and negative cases (AUROC). This could be due to the Top-K method focusing on the most probable outputs, leading to better discrimination.