## Box Plots: ECE and AUROC Performance Comparison
### Overview
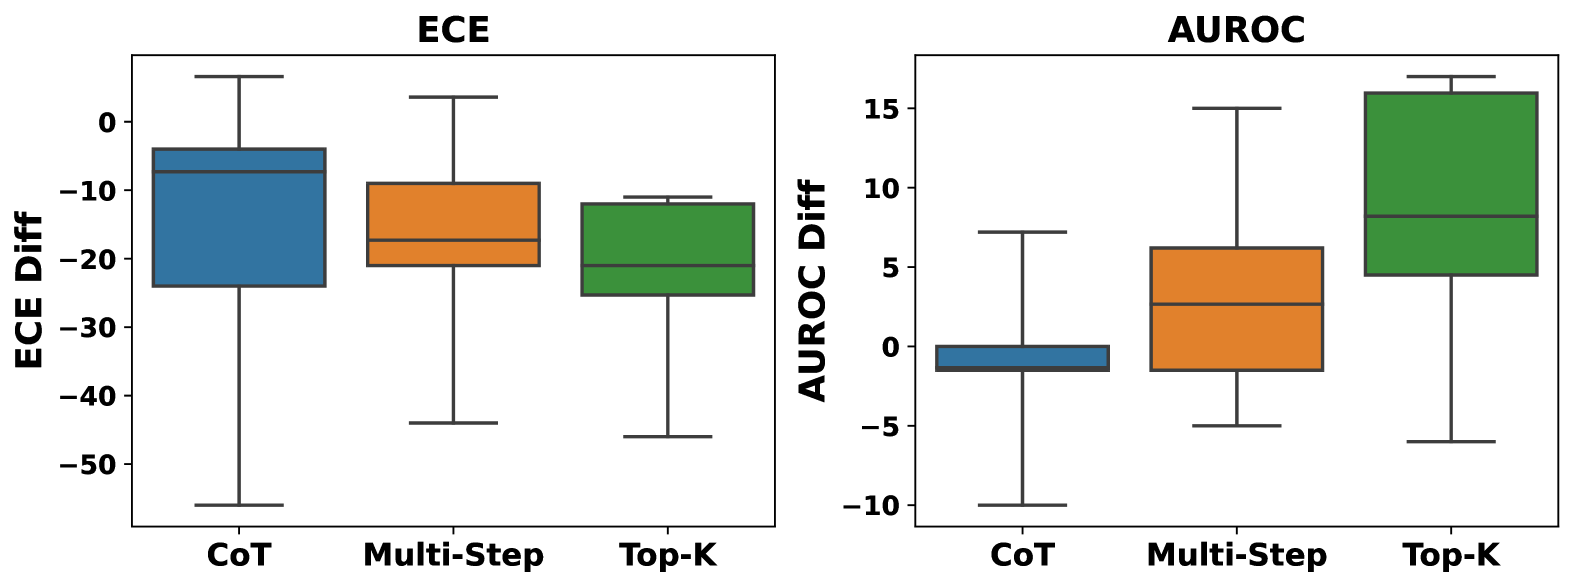
The image contains two side-by-side box plots comparing performance metrics (ECE and AUROC) across three methods: Chain-of-Thought (CoT), Multi-Step, and Top-K. Each plot uses distinct colors (blue, orange, green) to represent the methods, with legends positioned to the right of each plot.
### Components/Axes
- **Left Plot (ECE)**:
- **Y-Axis**: "ECE Diff" (Error Calibration Error Difference), ranging from -50 to 0.
- **X-Axis**: Methods labeled "CoT", "Multi-Step", "Top-K".
- **Legend**: Blue = CoT, Orange = Multi-Step, Green = Top-K.
- **Right Plot (AUROC)**:
- **Y-Axis**: "AUROC Diff" (Area Under the Receiver Operating Characteristic Curve Difference), ranging from -10 to 15.
- **X-Axis**: Same methods as the left plot.
- **Legend**: Same color coding as the left plot.
### Detailed Analysis
#### ECE Plot
- **CoT (Blue)**:
- Median: ~-15.
- Range: -50 (minimum) to 0 (maximum).
- Interquartile Range (IQR): ~-20 to -10.
- **Multi-Step (Orange)**:
- Median: ~-20.
- Range: -40 to 0.
- IQR: ~-25 to -15.
- **Top-K (Green)**:
- Median: ~-25.
- Range: -30 to -10.
- IQR: ~-28 to -22.
#### AUROC Plot
- **CoT (Blue)**:
- Median: ~-2.
- Range: -10 to 5.
- IQR: ~-4 to -1.
- **Multi-Step (Orange)**:
- Median: ~2.
- Range: -5 to 15.
- IQR: ~-2 to 5.
- **Top-K (Green)**:
- Median: ~8.
- Range: 0 to 15.
- IQR: ~5 to 12.
### Key Observations
1. **ECE Performance**:
- Top-K consistently shows the lowest (most negative) ECE values, indicating better calibration.
- CoT has the widest spread, suggesting higher variability in error calibration.
2. **AUROC Performance**:
- Top-K achieves the highest median AUROC (~8) and the largest range (0–15), indicating superior discriminative ability.
- CoT underperforms with a median of ~-2 and a narrower range (-10 to 5).
3. **Method Trends**:
- Both metrics show Top-K outperforming other methods.
- ECE values are uniformly negative, while AUROC values span both negative and positive ranges.
### Interpretation
The data suggests that the **Top-K** method is the most effective across both evaluation metrics. In ECE, Top-K’s lower (more negative) values imply better calibration of predicted probabilities, while in AUROC, its higher values reflect stronger model discrimination between classes. The wider spread in Top-K’s AUROC indicates greater variability in performance, possibly due to sampling strategies or dataset characteristics. CoT and Multi-Step methods exhibit suboptimal performance, with CoT showing the least consistency in ECE and AUROC. These results may guide method selection in applications requiring reliable probabilistic predictions and robust classification.