## Line Chart: Precision, Recall, and F1 Score vs. Iteration Steps
### Overview
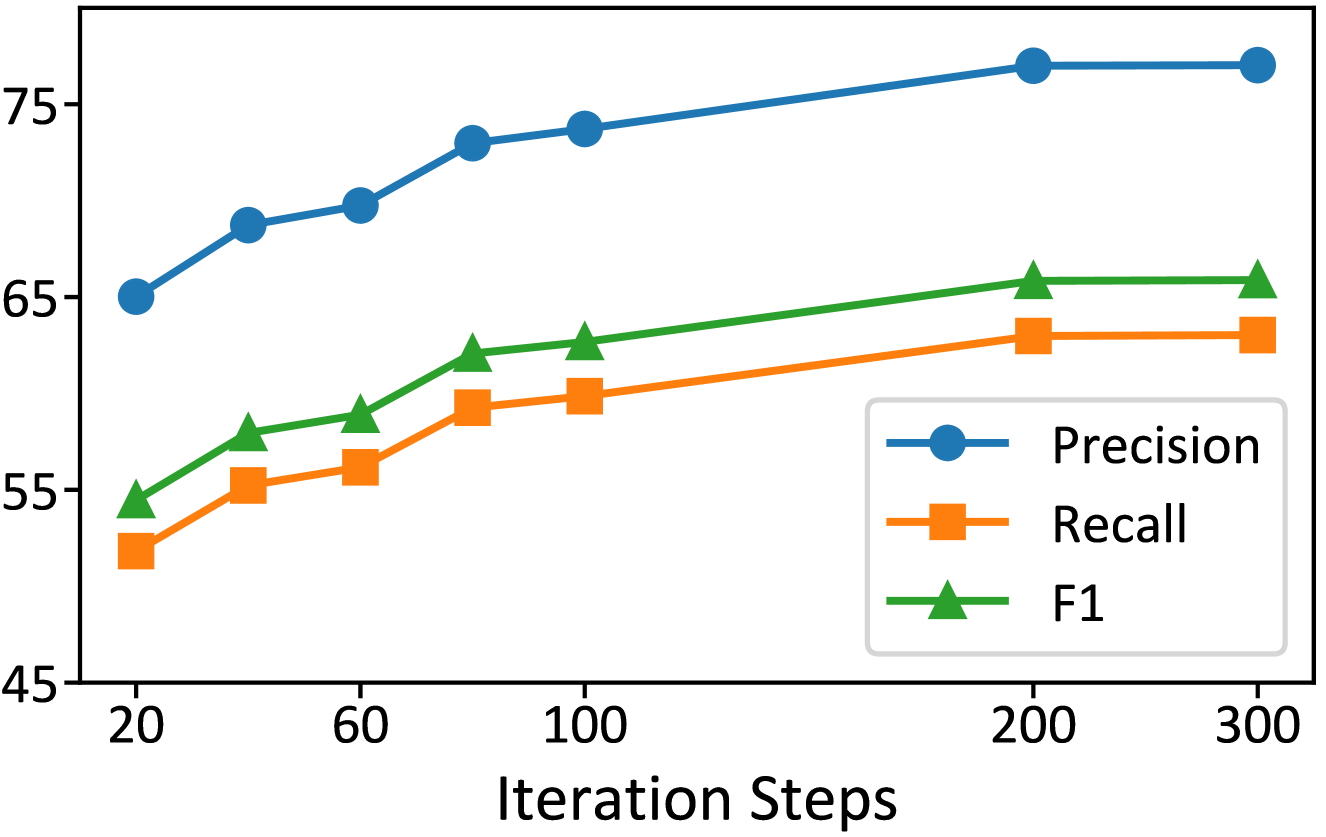
The image is a line chart comparing the performance of Precision, Recall, and F1 score over a range of iteration steps. The x-axis represents the number of iteration steps, while the y-axis represents the score values. The chart displays how these metrics change as the number of iteration steps increases.
### Components/Axes
* **X-axis:** "Iteration Steps" with tick marks at 20, 60, 100, 200, and 300.
* **Y-axis:** Numerical scale ranging from 45 to 75, with tick marks at 45, 55, 65, and 75.
* **Legend:** Located on the bottom-right of the chart, it identifies the lines as follows:
* Blue line with circle markers: "Precision"
* Orange line with square markers: "Recall"
* Green line with triangle markers: "F1"
### Detailed Analysis
* **Precision (Blue Line):** The precision starts at approximately 65 at 20 iteration steps, increases to approximately 69 at 60 steps, reaches around 73.5 at 100 steps, and plateaus at approximately 76 at 200 and 300 steps.
* **Recall (Orange Line):** The recall starts at approximately 52 at 20 iteration steps, increases to approximately 56 at 60 steps, reaches around 59 at 100 steps, approximately 63.5 at 200 steps, and approximately 64 at 300 steps.
* **F1 (Green Line):** The F1 score starts at approximately 54 at 20 iteration steps, increases to approximately 58 at 60 steps, reaches around 63 at 100 steps, approximately 65.5 at 200 steps, and approximately 65.5 at 300 steps.
### Key Observations
* Precision consistently outperforms both Recall and F1 score across all iteration steps.
* All three metrics show an increase with more iteration steps, but the rate of increase diminishes as the number of steps increases, especially for Precision.
* Recall and F1 score are very close in value, with F1 score being slightly higher.
### Interpretation
The chart suggests that increasing the number of iteration steps improves the performance of the model in terms of precision, recall, and F1 score. However, the improvement diminishes as the number of steps increases, indicating a point of diminishing returns. The higher precision compared to recall suggests that the model is better at avoiding false positives than false negatives. The F1 score, being the harmonic mean of precision and recall, provides a balanced measure of the model's accuracy. The convergence of all three metrics at higher iteration steps indicates that the model's performance stabilizes after a certain number of iterations.