\n
## Line Chart: Performance Metrics vs. Iteration Steps
### Overview
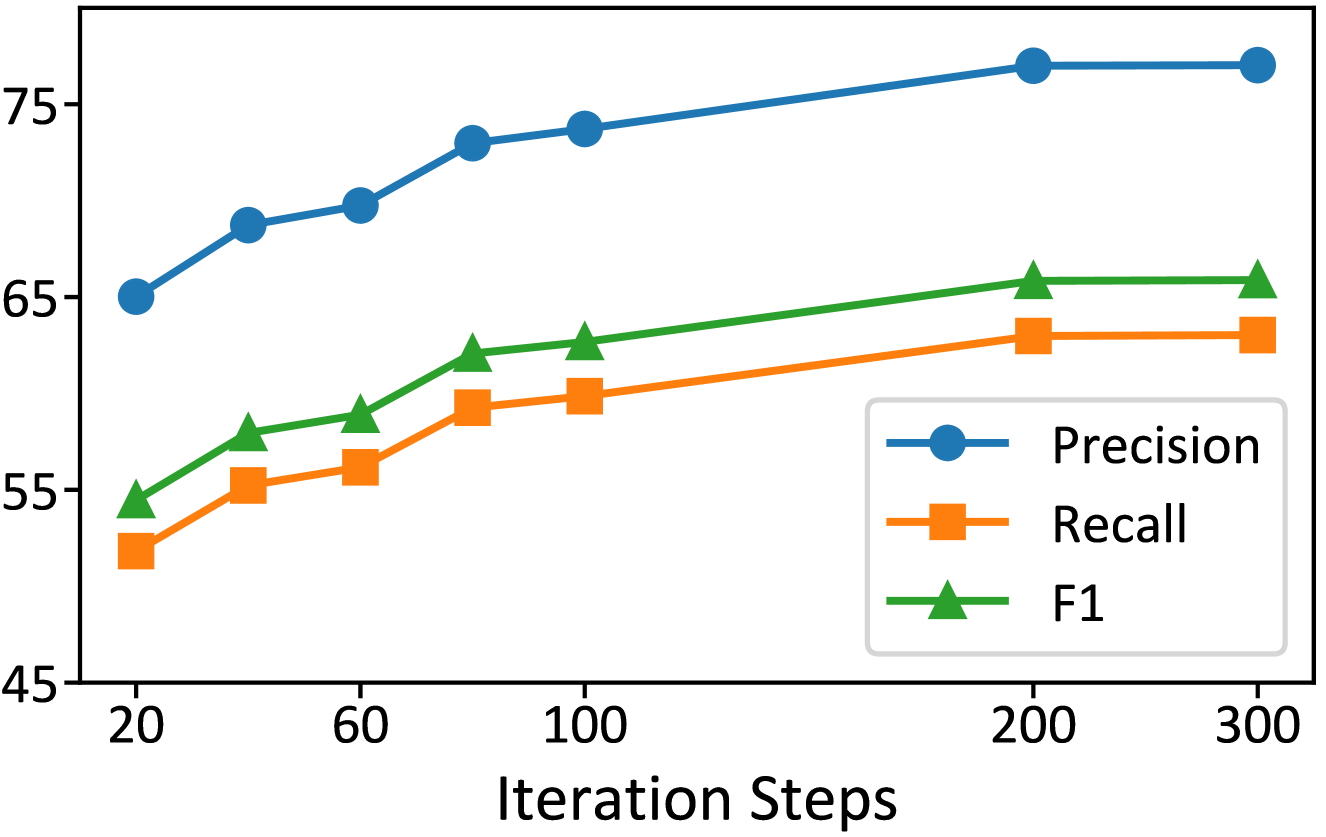
The image presents a line chart illustrating the performance of a system or algorithm over iteration steps. The chart tracks three key metrics: Precision, Recall, and F1-score. The x-axis represents the number of iteration steps, ranging from 20 to 300. The y-axis represents the metric values, ranging from 45 to 75.
### Components/Axes
* **X-axis:** "Iteration Steps" with markers at 20, 60, 100, 200, and 300.
* **Y-axis:** Scale ranging from 45 to 75.
* **Legend (Top-Right):**
* Blue Circle: "Precision"
* Orange Square: "Recall"
* Green Triangle: "F1"
### Detailed Analysis
* **Precision (Blue Line):** The line slopes upward, indicating increasing precision with more iteration steps.
* At 20 Iteration Steps: Approximately 64.
* At 60 Iteration Steps: Approximately 70.
* At 100 Iteration Steps: Approximately 73.
* At 200 Iteration Steps: Approximately 75.
* At 300 Iteration Steps: Approximately 75.
* **Recall (Orange Line):** The line also slopes upward, but at a slower rate than Precision.
* At 20 Iteration Steps: Approximately 49.
* At 60 Iteration Steps: Approximately 57.
* At 100 Iteration Steps: Approximately 60.
* At 200 Iteration Steps: Approximately 62.
* At 300 Iteration Steps: Approximately 62.
* **F1-Score (Green Line):** The line shows an upward trend, representing a balance between Precision and Recall.
* At 20 Iteration Steps: Approximately 54.
* At 60 Iteration Steps: Approximately 62.
* At 100 Iteration Steps: Approximately 65.
* At 200 Iteration Steps: Approximately 67.
* At 300 Iteration Steps: Approximately 68.
### Key Observations
* Precision increases rapidly in the initial iteration steps (20-60) and then plateaus.
* Recall shows a more gradual increase throughout all iteration steps.
* The F1-score, which combines Precision and Recall, demonstrates a steady improvement but remains lower than Precision.
* The gap between Precision and Recall narrows as the number of iteration steps increases.
### Interpretation
The chart suggests that the system or algorithm improves its performance with more iteration steps. Initially, the gains in Precision are more significant, but as the process continues, the improvements become more modest. The relatively lower F1-score indicates that while the system becomes more accurate (Precision), it doesn't necessarily improve its ability to find all relevant instances (Recall) at the same rate. The plateauing of Precision after 200 iteration steps suggests diminishing returns, and further iterations may not yield substantial improvements. This could indicate a point of convergence or the need for a different approach to further enhance performance. The relationship between Precision and Recall is important, and the F1-score provides a balanced metric for evaluating the overall effectiveness of the system.