## Line Graph: Model Performance Metrics Over Iteration Steps
### Overview
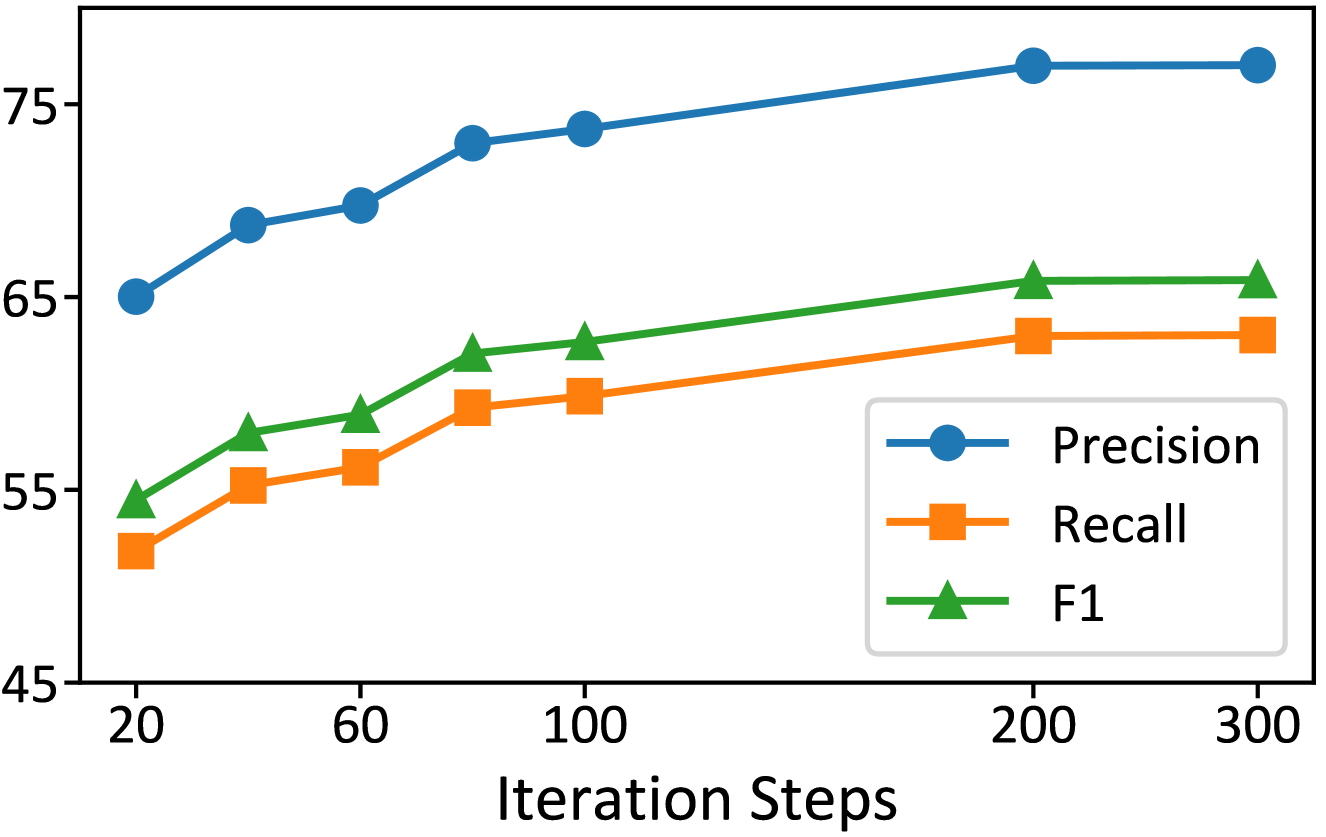
The graph illustrates the progression of three model evaluation metrics—Precision, Recall, and F1 Score—across 300 iteration steps. All metrics show an upward trend, with Precision consistently outperforming the others throughout the iterations.
### Components/Axes
- **X-axis (Iteration Steps)**: Ranges from 20 to 300 in increments of 20, 40, 60, etc.
- **Y-axis (Metric Values)**: Scaled from 45 to 75 in increments of 5.
- **Legend**: Right-aligned, with:
- **Blue circles**: Precision
- **Orange squares**: Recall
- **Green triangles**: F1 Score
### Detailed Analysis
1. **Precision (Blue Line)**:
- Starts at ~65 at 20 steps.
- Increases steadily to ~75 by 100 steps.
- Plateaus at ~76 from 200 to 300 steps.
- **Trend**: Sharp initial growth, then stabilization.
2. **Recall (Orange Line)**:
- Begins at ~53 at 20 steps.
- Rises to ~64 by 200 steps, remaining flat at 300 steps.
- **Trend**: Gradual, linear increase with no plateau until final steps.
3. **F1 Score (Green Line)**:
- Starts at ~55 at 20 steps.
- Reaches ~65 by 200 steps, maintaining this value at 300 steps.
- **Trend**: Steady, moderate growth, closely tracking Recall but slightly higher.
### Key Observations
- **Precision Dominance**: Precision remains the highest metric across all steps, suggesting the model prioritizes minimizing false positives.
- **Recall and F1 Convergence**: Recall and F1 scores improve in tandem, with F1 slightly outperforming Recall in later steps.
- **Diminishing Returns**: Precision stabilizes after 100 steps, while Recall and F1 continue improving until 200 steps.
### Interpretation
The data indicates that increasing iteration steps enhances model performance, with Precision being the most stable and dominant metric. The F1 Score’s improvement reflects a balanced enhancement in both Precision and Recall, though it lags behind Precision. The plateau in Precision after 100 steps suggests diminishing gains in false positive reduction, while Recall and F1 continue to benefit from further iterations. This pattern may imply a trade-off between computational efficiency and marginal performance gains in later training phases.