## Heatmap Charts: Pairwise Agent Analysis
### Overview
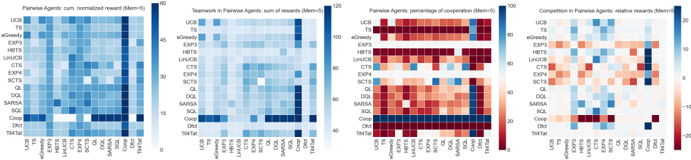
The image presents four heatmaps comparing the performance of different pairwise agents across various metrics. The agents are compared based on cumulative normalized reward, teamwork (sum of rewards), percentage of cooperation, and relative rewards in competition. Each heatmap visualizes the interactions between the same set of agents, allowing for a direct comparison of their behavior under different evaluation criteria.
### Components/Axes
**General Components:**
* **Agents (Rows & Columns):** The same set of agents are listed on both the x and y axes of each heatmap. The agents are: UCB, TS, eGreedy, EXP3, HBTS, LinUCB, CTS, EXP4, SCTS, QL, DQL, SARSA, SQL, Coop, Dfct, and Tit4Tat.
* **Color Scales:** Each heatmap has its own color scale, indicating the range of values represented by the colors.
* **Titles:** Each heatmap has a title indicating the metric being visualized.
**Specific Axes and Scales:**
1. **Pairwise Agents: cum. normalized reward (Mem=5):**
* Y-axis: Agent types (UCB, TS, eGreedy, EXP3, HBTS, LinUCB, CTS, EXP4, SCTS, QL, DQL, SARSA, SQL, Coop, Dfct, Tit4Tat).
* X-axis: Agent types (UCB, TS, eGreedy, EXP3, HBTS, LinUCB, CTS, EXP4, SCTS, QL, DQL, SARSA, SQL, Coop, Dfct, Tit4Tat).
* Color Scale: Blue, ranging from approximately 0 to 60, representing the cumulative normalized reward.
2. **Teamwork in Pairwise Agents: sum of rewards (Mem=5):**
* Y-axis: Agent types (UCB, TS, eGreedy, EXP3, HBTS, LinUCB, CTS, EXP4, SCTS, QL, DQL, SARSA, SQL, Coop, Dfct, Tit4Tat).
* X-axis: Agent types (UCB, TS, eGreedy, EXP3, HBTS, LinUCB, CTS, EXP4, SCTS, QL, DQL, SARSA, SQL, Coop, Dfct, Tit4Tat).
* Color Scale: Blue, ranging from approximately 40 to 120, representing the sum of rewards.
3. **Pairwise Agents: percentage of cooperation (Mem=5):**
* Y-axis: Agent types (UCB, TS, eGreedy, EXP3, HBTS, LinUCB, CTS, EXP4, SCTS, QL, DQL, SARSA, SQL, Coop, Dfct, Tit4Tat).
* X-axis: Agent types (UCB, TS, eGreedy, EXP3, HBTS, LinUCB, CTS, EXP4, SCTS, QL, DQL, SARSA, SQL, Coop, Dfct, Tit4Tat).
* Color Scale: Ranges from red to blue, with red representing low cooperation (0) and blue representing high cooperation (100).
4. **Competition in Pairwise Agents: relative rewards (Mem=5):**
* Y-axis: Agent types (UCB, TS, eGreedy, EXP3, HBTS, LinUCB, CTS, EXP4, SCTS, QL, DQL, SARSA, SQL, Coop, Dfct, Tit4Tat).
* X-axis: Agent types (UCB, TS, eGreedy, EXP3, HBTS, LinUCB, CTS, EXP4, SCTS, QL, DQL, SARSA, SQL, Coop, Dfct, Tit4Tat).
* Color Scale: Ranges from red to blue, with red representing negative relative rewards (-20) and blue representing positive relative rewards (20).
### Detailed Analysis
**1. Pairwise Agents: cum. normalized reward (Mem=5):**
* The diagonal elements (interaction of an agent with itself) show moderate to high rewards, indicated by medium to dark blue shades.
* Coop, Dfct, and Tit4Tat show high rewards when interacting with each other (dark blue).
* Other agents show varying degrees of reward when interacting with Coop, Dfct, and Tit4Tat, generally lower than the self-interaction rewards.
**2. Teamwork in Pairwise Agents: sum of rewards (Mem=5):**
* The diagonal elements show moderate rewards (light blue).
* Coop, Dfct, and Tit4Tat show high rewards when interacting with each other (dark blue).
* Interactions between other agents are generally low to moderate (light blue).
**3. Pairwise Agents: percentage of cooperation (Mem=5):**
* The diagonal elements show varying degrees of cooperation.
* Coop, Dfct, and Tit4Tat show very high cooperation with each other (dark blue).
* Other agents show low cooperation with Dfct (red).
* UCB, TS, eGreedy, EXP3, HBTS, LinUCB, CTS, EXP4, SCTS, QL, DQL, SARSA, SQL show high cooperation with each other (dark blue).
**4. Competition in Pairwise Agents: relative rewards (Mem=5):**
* The diagonal elements show near-zero relative rewards (white/light shades).
* Coop, Dfct, and Tit4Tat show negative relative rewards when interacting with other agents (red).
* Other agents show positive relative rewards when interacting with Coop, Dfct, and Tit4Tat (blue).
### Key Observations
* **Coop, Dfct, and Tit4Tat:** These agents consistently show high cooperation and teamwork among themselves but are exploited by other agents in competitive scenarios.
* **UCB, TS, eGreedy, EXP3, HBTS, LinUCB, CTS, EXP4, SCTS, QL, DQL, SARSA, SQL:** These agents tend to cooperate with each other and exploit Coop, Dfct, and Tit4Tat in competitive settings.
* **Diagonal Elements:** The diagonal elements in the cooperation and competition heatmaps are generally neutral, indicating that agents neither strongly cooperate nor compete with themselves.
### Interpretation
The heatmaps provide a comprehensive view of how different agents interact in pairwise scenarios. The data suggests that:
* **Cooperative Strategies:** Coop, Dfct, and Tit4Tat are effective in environments that reward cooperation but are vulnerable to exploitation in competitive environments.
* **Exploitative Strategies:** UCB, TS, eGreedy, EXP3, HBTS, LinUCB, CTS, EXP4, SCTS, QL, DQL, SARSA, SQL are more successful in competitive environments, likely due to their ability to exploit cooperative strategies.
* **Trade-off:** There is a clear trade-off between cooperation and competitiveness. Agents that prioritize cooperation may achieve high rewards in collaborative settings but are easily exploited in competitive ones.
The "Mem=5" likely refers to a memory parameter, indicating that the agents consider the past 5 interactions when making decisions. This parameter influences the agents' strategies and their ability to adapt to different environments.