TECHNICAL ASSET FINGERPRINT
584f8453dc1c7740f1a3acd6
Click to view fullscreen
Press ESC or click to close
FOUND IN PAPERS
EXPERT: gemini-2.5-flash-lite-free VERSION 1
RUNTIME: google-free/gemini-2.5-flash-lite
INTEL_VERIFIED
## Heatmaps: Pairwise Agent Performance Metrics
### Overview
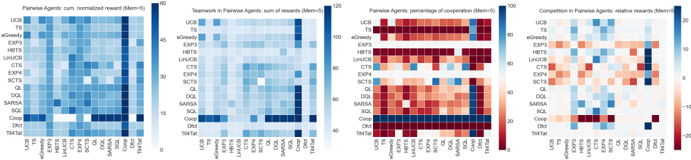
This image displays four heatmaps, each representing a different performance metric for pairwise interactions between various agents. The agents are listed on both the x-axis and y-axis, indicating that each cell represents the interaction between the agent on the y-axis (row) and the agent on the x-axis (column). The color intensity of each cell corresponds to the value of the metric, with color bars providing a scale for interpretation. The metrics are: "Pairwise Agents: cum. normalized reward (Mem=5)", "Teamwork in Pairwise Agents: sum of rewards (Mem=5)", "Pairwise Agents: percentage of cooperation (Mem=5)", and "Competition in Pairwise Agents: relative rewards (Mem=5)".
### Components/Axes
**General Structure:**
Each heatmap has:
- **Y-axis Labels:** A list of agent names vertically aligned on the left.
- **X-axis Labels:** A list of agent names horizontally aligned at the bottom.
- **Color Bar:** A vertical bar to the right of each heatmap indicating the scale and corresponding color for the metric's values.
**Agent List (Common to all heatmaps):**
- UCB
- TS
- eGreedy
- EXP3
- HBTS
- LinUCB
- CTS
- EXP4
- SCTS
- QL
- DQL
- SARSA
- SQL
- Coop
- DIct
- TxtTat
**Heatmap 1: Pairwise Agents: cum. normalized reward (Mem=5)**
- **Title:** Pairwise Agents: cum. normalized reward (Mem=5)
- **Y-axis Title:** (Implicitly, Agent on Y-axis)
- **X-axis Title:** (Implicitly, Agent on X-axis)
- **Color Bar:** Ranges from light blue (low values) to dark blue (high values).
- **Scale Markers:** 0, 15, 30, 45, 60.
**Heatmap 2: Teamwork in Pairwise Agents: sum of rewards (Mem=5)**
- **Title:** Teamwork in Pairwise Agents: sum of rewards (Mem=5)
- **Y-axis Title:** (Implicitly, Agent on Y-axis)
- **X-axis Title:** (Implicitly, Agent on X-axis)
- **Color Bar:** Ranges from light blue (low values) to dark blue (high values).
- **Scale Markers:** 0, 20, 40, 60, 80, 100, 120.
**Heatmap 3: Pairwise Agents: percentage of cooperation (Mem=5)**
- **Title:** Pairwise Agents: percentage of cooperation (Mem=5)
- **Y-axis Title:** (Implicitly, Agent on Y-axis)
- **X-axis Title:** (Implicitly, Agent on X-axis)
- **Color Bar:** Ranges from dark red (low values) to dark blue (high values), with white/light colors in the middle.
- **Scale Markers:** 0, 20, 40, 60, 80, 100.
**Heatmap 4: Competition in Pairwise Agents: relative rewards (Mem=5)**
- **Title:** Competition in Pairwise Agents: relative rewards (Mem=5)
- **Y-axis Title:** (Implicitly, Agent on Y-axis)
- **X-axis Title:** (Implicitly, Agent on X-axis)
- **Color Bar:** Ranges from dark red (low values) to dark blue (high values), with white/light colors in the middle.
- **Scale Markers:** -20, -10, 0, 10, 20.
### Detailed Analysis
**Heatmap 1: Pairwise Agents: cum. normalized reward (Mem=5)**
- **Trend:** Generally, there are many interactions with moderate to high normalized rewards (indicated by shades of blue). The diagonal (self-interaction) is not explicitly shown or is assumed to be a baseline.
- **Key Data Points (Approximate, based on color intensity):**
- **High Rewards (Dark Blue, ~45-60):**
- Coop vs. Coop: Appears to be the highest, close to 60.
- DIct vs. Coop: High, around 45-50.
- Coop vs. DIct: High, around 45-50.
- SQL vs. SQL: High, around 45-50.
- SARSA vs. SQL: High, around 45-50.
- QL vs. SQL: High, around 45-50.
- SCTS vs. SQL: High, around 45-50.
- EXP4 vs. SQL: High, around 45-50.
- CTS vs. SQL: High, around 45-50.
- LinUCB vs. SQL: High, around 45-50.
- HBTS vs. SQL: High, around 45-50.
- EXP3 vs. SQL: High, around 45-50.
- eGreedy vs. SQL: High, around 45-50.
- TS vs. SQL: High, around 45-50.
- UCB vs. SQL: High, around 45-50.
- SQL vs. Coop: High, around 45-50.
- **Moderate Rewards (Medium Blue, ~15-30):** Many interactions fall into this category, for example, UCB vs. TS, TS vs. eGreedy, etc.
- **Low Rewards (Light Blue/White, ~0-15):** Some interactions, like TxtTat vs. most other agents, appear to have lower normalized rewards.
**Heatmap 2: Teamwork in Pairwise Agents: sum of rewards (Mem=5)**
- **Trend:** Similar to the first heatmap, there are many interactions with high sums of rewards, particularly where "Coop" and "SQL" are involved.
- **Key Data Points (Approximate):**
- **High Rewards (Dark Blue, ~100-120):**
- Coop vs. Coop: Appears to be the highest, close to 120.
- DIct vs. Coop: High, around 100-110.
- Coop vs. DIct: High, around 100-110.
- SQL vs. SQL: High, around 100-110.
- SARSA vs. SQL: High, around 100-110.
- QL vs. SQL: High, around 100-110.
- SCTS vs. SQL: High, around 100-110.
- EXP4 vs. SQL: High, around 100-110.
- CTS vs. SQL: High, around 100-110.
- LinUCB vs. SQL: High, around 100-110.
- HBTS vs. SQL: High, around 100-110.
- EXP3 vs. SQL: High, around 100-110.
- eGreedy vs. SQL: High, around 100-110.
- TS vs. SQL: High, around 100-110.
- UCB vs. SQL: High, around 100-110.
- SQL vs. Coop: High, around 100-110.
- **Moderate Rewards (Medium Blue, ~40-80):** Many interactions fall into this range.
- **Low Rewards (Light Blue/White, ~0-40):** TxtTat vs. many agents shows low sums of rewards.
**Heatmap 3: Pairwise Agents: percentage of cooperation (Mem=5)**
- **Trend:** This heatmap shows a clear divergence. Many interactions are either very high in cooperation (dark blue, ~80-100%) or very low (dark red, ~0-20%). There are fewer interactions in the mid-range.
- **Key Data Points (Approximate):**
- **High Cooperation (Dark Blue, ~80-100%):**
- Coop vs. Coop: Appears to be 100%.
- DIct vs. Coop: High, around 90-100%.
- Coop vs. DIct: High, around 90-100%.
- SQL vs. SQL: High, around 90-100%.
- SARSA vs. SQL: High, around 90-100%.
- QL vs. SQL: High, around 90-100%.
- SCTS vs. SQL: High, around 90-100%.
- EXP4 vs. SQL: High, around 90-100%.
- CTS vs. SQL: High, around 90-100%.
- LinUCB vs. SQL: High, around 90-100%.
- HBTS vs. SQL: High, around 90-100%.
- EXP3 vs. SQL: High, around 90-100%.
- eGreedy vs. SQL: High, around 90-100%.
- TS vs. SQL: High, around 90-100%.
- UCB vs. SQL: High, around 90-100%.
- SQL vs. Coop: High, around 90-100%.
- **Low Cooperation (Dark Red, ~0-20%):**
- UCB vs. UCB: Appears to be very low, close to 0%.
- TS vs. TS: Appears to be very low, close to 0%.
- eGreedy vs. eGreedy: Appears to be very low, close to 0%.
- EXP3 vs. EXP3: Appears to be very low, close to 0%.
- HBTS vs. HBTS: Appears to be very low, close to 0%.
- LinUCB vs. LinUCB: Appears to be very low, close to 0%.
- CTS vs. CTS: Appears to be very low, close to 0%.
- EXP4 vs. EXP4: Appears to be very low, close to 0%.
- SCTS vs. SCTS: Appears to be very low, close to 0%.
- QL vs. QL: Appears to be very low, close to 0%.
- DQL vs. DQL: Appears to be very low, close to 0%.
- SARSA vs. SARSA: Appears to be very low, close to 0%.
- SQL vs. SQL: High cooperation (as noted above).
- Coop vs. Coop: High cooperation (as noted above).
- DIct vs. DIct: Appears to be very low, close to 0%.
- TxtTat vs. TxtTat: Appears to be very low, close to 0%.
- **Mixed Cooperation:** Some interactions show moderate cooperation (e.g., UCB vs. TS, TS vs. eGreedy).
**Heatmap 4: Competition in Pairwise Agents: relative rewards (Mem=5)**
- **Trend:** This heatmap shows relative advantages. Dark blue indicates the row agent has a relative reward advantage over the column agent, while dark red indicates the column agent has an advantage.
- **Key Data Points (Approximate):**
- **Row Agent Advantage (Dark Blue, ~10-20):**
- Coop vs. DIct: Appears to have a significant advantage for Coop, around 15-20.
- DIct vs. Coop: Appears to have a significant advantage for DIct, around 15-20.
- SQL vs. SARSA: Appears to have an advantage for SQL, around 10-15.
- SQL vs. QL: Appears to have an advantage for SQL, around 10-15.
- SQL vs. SCTS: Appears to have an advantage for SQL, around 10-15.
- SQL vs. EXP4: Appears to have an advantage for SQL, around 10-15.
- SQL vs. CTS: Appears to have an advantage for SQL, around 10-15.
- SQL vs. LinUCB: Appears to have an advantage for SQL, around 10-15.
- SQL vs. HBTS: Appears to have an advantage for SQL, around 10-15.
- SQL vs. EXP3: Appears to have an advantage for SQL, around 10-15.
- SQL vs. eGreedy: Appears to have an advantage for SQL, around 10-15.
- SQL vs. TS: Appears to have an advantage for SQL, around 10-15.
- SQL vs. UCB: Appears to have an advantage for SQL, around 10-15.
- **Column Agent Advantage (Dark Red, ~-10 to -20):**
- DIct vs. Coop: Appears to have a significant advantage for Coop, around -15 to -20.
- Coop vs. DIct: Appears to have a significant advantage for DIct, around -15 to -20.
- SARSA vs. SQL: Appears to have an advantage for SQL, around -10 to -15.
- QL vs. SQL: Appears to have an advantage for SQL, around -10 to -15.
- SCTS vs. SQL: Appears to have an advantage for SQL, around -10 to -15.
- EXP4 vs. SQL: Appears to have an advantage for SQL, around -10 to -15.
- CTS vs. SQL: Appears to have an advantage for SQL, around -10 to -15.
- LinUCB vs. SQL: Appears to have an advantage for SQL, around -10 to -15.
- HBTS vs. SQL: Appears to have an advantage for SQL, around -10 to -15.
- EXP3 vs. SQL: Appears to have an advantage for SQL, around -10 to -15.
- eGreedy vs. SQL: Appears to have an advantage for SQL, around -10 to -15.
- TS vs. SQL: Appears to have an advantage for SQL, around -10 to -15.
- UCB vs. SQL: Appears to have an advantage for SQL, around -10 to -15.
- **Neutral/Slight Advantage (White/Light Colors, ~-5 to 5):** Many interactions fall into this category, indicating relatively balanced performance.
### Key Observations
* **"Coop" and "SQL" Agents:** These two agents consistently show very high performance across normalized reward, sum of rewards, and percentage of cooperation when interacting with themselves or each other, and when interacting with many other agents. They also appear to be strong performers in terms of relative rewards when paired against many other agents.
* **Self-Interaction:** For most agents (except "Coop" and "SQL"), self-interaction (diagonal elements) shows very low cooperation and potentially low normalized rewards, suggesting these agents do not perform optimally when interacting with themselves in a cooperative manner.
* **"TxtTat" Agent:** This agent consistently shows very low performance across normalized reward and sum of rewards when interacting with most other agents, and also exhibits low cooperation.
* **Divergent Cooperation:** The "percentage of cooperation" heatmap reveals a stark dichotomy: agents either cooperate very highly or very poorly, with few in between. This suggests distinct behavioral modes.
* **Relative Strength:** The "relative rewards" heatmap highlights specific pairwise advantages. For instance, "Coop" and "DIct" seem to have a strong reciprocal advantage over each other, while "SQL" generally has an advantage over many other agents.
### Interpretation
The heatmaps collectively illustrate the performance landscape of different agents in pairwise interactions, likely within a reinforcement learning or game theory context, given the agent names (e.g., UCB, QL, SARSA, SQL). The parameter "(Mem=5)" suggests a memory component of size 5 might be influencing these results.
**What the data suggests or demonstrates:**
1. **Emergence of Strong Performers:** The "Coop" and "SQL" agents appear to be highly effective, exhibiting robust performance in terms of reward accumulation and cooperative behavior. Their consistent high scores suggest they might be well-suited for environments that reward collaboration or efficient strategy.
2. **Cooperation vs. Competition Dynamics:** The "percentage of cooperation" heatmap is particularly insightful. The high cooperation between "Coop" and "SQL" (and their self-interactions) suggests these agents are designed or have learned to be highly cooperative. Conversely, the low cooperation for many other agents' self-interactions indicates a potential lack of intrinsic cooperative mechanisms or a tendency towards competitive self-play.
3. **Agent Specialization/Behavioral Modes:** The stark contrast in cooperation levels suggests that agents might operate in distinct behavioral modes. Some agents are inherently cooperative, while others are not. This could be a result of their underlying algorithms or training objectives.
4. **Relative Power Structures:** The "relative rewards" heatmap maps out a hierarchy or set of advantages. "SQL" appears to be a dominant agent against many others, while "Coop" and "DIct" have a strong, mutually beneficial relationship. The negative values indicate that in those pairings, the *column* agent is outperforming the *row* agent.
5. **Ineffective Agents:** The "TxtTat" agent seems to be consistently underperforming, suggesting it may be an experimental agent, a baseline that is not competitive, or an agent that is poorly suited to the tested environment.
**How the elements relate to each other:**
The four heatmaps provide a multi-faceted view of agent performance.
- Heatmaps 1 and 2 ("normalized reward" and "sum of rewards") show the overall success in terms of accumulated value.
- Heatmap 3 ("percentage of cooperation") explains *how* that success is achieved – through collaboration or lack thereof.
- Heatmap 4 ("relative rewards") clarifies the competitive aspect, showing who gains an advantage when cooperation is not fully realized or when agents are pitted against each other.
The strong correlation between high rewards (Heatmaps 1 & 2) and high cooperation (Heatmap 3) for agents like "Coop" and "SQL" suggests that in this context, cooperation is a key driver of success. The "relative rewards" heatmap then shows how these cooperative agents fare against less cooperative ones, or how non-cooperative agents compete amongst themselves.
**Any notable outliers, trends, or anomalies:**
- The extreme self-cooperation of "Coop" and "SQL" is a significant trend.
- The extreme self-defection/low cooperation of most other agents is also a notable trend.
- The consistent poor performance of "TxtTat" is an anomaly if it's expected to be a competitive agent.
- The reciprocal high advantage between "Coop" and "DIct" in relative rewards is interesting, as is the broad dominance of "SQL" over many other agents.
DECODING INTELLIGENCE...