\n
## Heatmaps: Pairwise Agent Performance Metrics
### Overview
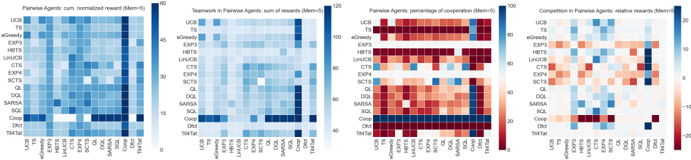
The image presents four heatmaps, each visualizing a different metric related to the performance of various agents in a pairwise setting. The agents are listed on the y-axis, and the other agent they are being compared against is listed on the x-axis. Each cell in the heatmap represents the value of the metric for that specific agent pair, with color intensity indicating the magnitude of the value.
### Components/Axes
Each heatmap shares the following components:
* **Y-axis (Vertical):** Lists the agents being evaluated. The agents are: UCB, eComedy, EXP3, HBT3, LINUCB, CTB, EXP1, SCTS, QL, DQL, SARSA, Coop, SQL, Old, Tital.
* **X-axis (Horizontal):** Lists the agents being compared against. The agents are: UCB, eComedy, EXP3, HBT3, LINUCB, CTB, EXP1, SCTS, QL, DQL, SARSA, Coop, SQL, Old, Tital.
* **Color Scale (Legend):** Each heatmap has a unique color scale indicating the range of values represented by the colors.
* **Heatmap 1 (Normalized Reward):** Color scale ranges from approximately 0 to 20. Blue indicates lower values, and red indicates higher values.
* **Heatmap 2 (Teamwork in Rewards):** Color scale ranges from approximately 0 to 20. Blue indicates lower values, and red indicates higher values.
* **Heatmap 3 (Percentage of Cooperation):** Color scale ranges from approximately 0 to 100. Blue indicates lower values, and red indicates higher values.
* **Heatmap 4 (Competition in Rewards):** Color scale ranges from approximately -15 to 15. Blue indicates lower values, and red indicates higher values.
### Detailed Analysis or Content Details
**Heatmap 1: Pairwise Agents, Normalized Reward (Mean)**
* The heatmap shows a generally sparse pattern of high rewards.
* The diagonal elements (agent vs. itself) are all approximately 0.
* The highest reward values (around 18-20) are observed for the pair (QL, QL), (DQL, DQL), (SARSA, SARSA), (Coop, Coop), (SQL, SQL).
* The agent 'Tital' consistently shows low normalized rewards when paired with other agents.
* The agent 'UCB' shows low normalized rewards when paired with other agents.
**Heatmap 2: Teamwork in Rewards (Mean)**
* The heatmap shows a generally sparse pattern of high teamwork rewards.
* The diagonal elements (agent vs. itself) are all approximately 0.
* The highest teamwork rewards (around 18-20) are observed for the pair (QL, QL), (DQL, DQL), (SARSA, SARSA), (Coop, Coop), (SQL, SQL).
* The agent 'Tital' consistently shows low teamwork rewards when paired with other agents.
* The agent 'UCB' shows low teamwork rewards when paired with other agents.
**Heatmap 3: Pairwise Agents, Percentage of Cooperation (Mean)**
* The heatmap shows a generally high percentage of cooperation across most agent pairs.
* The diagonal elements (agent vs. itself) are all approximately 100.
* The lowest cooperation percentages (around 0-20) are observed for the pair (Old, Old), (Tital, Tital).
* The agent 'Old' consistently shows low cooperation percentages when paired with other agents.
* The agent 'Tital' consistently shows low cooperation percentages when paired with other agents.
**Heatmap 4: Competition in Rewards (Mean)**
* The heatmap shows a mix of positive and negative competition values.
* The diagonal elements (agent vs. itself) are all approximately 0.
* The highest positive competition values (around 10-15) are observed for the pair (EXP3, EXP3), (HBT3, HBT3), (LINUCB, LINUCB), (CTB, CTB), (EXP1, EXP1), (SCTS, SCTS).
* The lowest negative competition values (around -10 to -15) are observed for the pair (QL, QL), (DQL, DQL), (SARSA, SARSA), (Coop, Coop), (SQL, SQL).
* The agent 'Tital' consistently shows negative competition values when paired with other agents.
### Key Observations
* Agents QL, DQL, SARSA, Coop, and SQL consistently exhibit high normalized rewards and teamwork rewards, but also high negative competition.
* Agents UCB and eComedy consistently exhibit low normalized rewards and teamwork rewards.
* Agents Old and Tital consistently exhibit low cooperation percentages and negative competition.
* The diagonal elements in all heatmaps indicate self-comparison, which generally results in expected values (0 for reward, 100 for cooperation).
### Interpretation
The data suggests that different agents exhibit varying levels of performance, cooperation, and competition when interacting with each other. Agents like QL, DQL, SARSA, Coop, and SQL appear to be effective at maximizing rewards and teamwork, but this comes at the cost of increased competition. Conversely, agents like UCB and eComedy struggle to achieve high rewards or teamwork. Agents Old and Tital are consistently poor performers in terms of cooperation and exhibit negative competition, suggesting they may be detrimental to overall system performance.
The relationship between the heatmaps reveals interesting trade-offs. For example, high normalized reward and teamwork often correlate with negative competition, indicating that these agents may be dominating resources or hindering the performance of others. The heatmap of competition provides insight into the dynamics of agent interactions, highlighting which agents are more likely to compete for resources or rewards.
The consistent low performance of agents Old and Tital suggests they may be poorly suited for the task or require further optimization. The high performance of agents QL, DQL, SARSA, Coop, and SQL suggests they are promising candidates for further development and deployment.