TECHNICAL ASSET FINGERPRINT
584f8453dc1c7740f1a3acd6
Click to view fullscreen
Press ESC or click to close
FOUND IN PAPERS
EXPERT: healer-alpha-free VERSION 1
RUNTIME: free/openrouter/healer-alpha
INTEL_VERIFIED
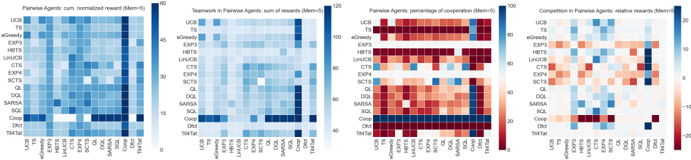
## Heatmap Series: Pairwise Agent Performance Metrics
### Overview
The image displays a horizontal series of four distinct heatmaps, each visualizing a different performance metric for pairwise interactions between various reinforcement learning or multi-agent algorithms. The heatmaps share a common structure: a square matrix with identical agent names on both the x-axis (bottom) and y-axis (left), with cell colors representing the value of the specified metric for each agent pair. A vertical color bar legend is positioned to the right of each heatmap.
### Components/Axes
**Common Elements (All Four Heatmaps):**
* **Y-Axis (Left):** Lists agent names. From top to bottom: `UCB`, `eGreedy`, `HBTs`, `LinUCB`, `LinTS`, `EXP3`, `QL`, `RHC`, `SARSA`, `DQN`, `Comp.`, `TS/TS`.
* **X-Axis (Bottom):** Lists the same agent names in the same order, from left to right.
* **Legend Placement:** A vertical color bar is located to the immediate right of each heatmap matrix.
* **Matrix Structure:** Each heatmap is an 11x11 grid (excluding the axis labels), representing all possible pairwise combinations of the 11 listed agents.
**Individual Heatmap Titles & Color Scales:**
1. **Leftmost Heatmap:**
* **Title:** `Pairwise Agents: cum. normalized reward (M=10^4)`
* **Color Bar Label:** `0` (bottom, dark blue) to `10` (top, light yellow/white).
* **Color Scheme:** Sequential blue-to-yellow gradient.
2. **Second Heatmap:**
* **Title:** `Teammate in Pairwise Agents: sum of rewards (M=10^4)`
* **Color Bar Label:** `0` (bottom, dark blue) to `120` (top, light yellow/white).
* **Color Scheme:** Sequential blue-to-yellow gradient.
3. **Third Heatmap:**
* **Title:** `Pairwise Agents: percentage of cooperation (M=10^4)`
* **Color Bar Label:** `40` (bottom, dark red) to `100` (top, light yellow/white).
* **Color Scheme:** Sequential red-to-yellow gradient.
4. **Rightmost Heatmap:**
* **Title:** `Competition in Pairwise Agents: relative rewards (M=10^4)`
* **Color Bar Label:** `-10` (bottom, dark red) to `10` (top, dark blue), with `0` at the midpoint (white/light gray).
* **Color Scheme:** Diverging red-white-blue gradient.
### Detailed Analysis
**1. Cumulative Normalized Reward Heatmap:**
* **Trend:** The matrix is predominantly blue, indicating most pairwise interactions yield low normalized rewards (0-3 range). Lighter cells (higher rewards) are sparse.
* **Data Points (Approximate):**
* The diagonal (e.g., UCB vs. UCB) is consistently dark blue (~0-1).
* The highest rewards (lightest cells, ~7-9) appear in isolated pairs, such as `TS/TS` vs. `DQN` (bottom-right quadrant) and `Comp.` vs. `SARSA`.
* The `TS/TS` row and column show slightly more lighter blue cells compared to others, suggesting it achieves moderately higher rewards against several opponents.
**2. Sum of Rewards (Teammate) Heatmap:**
* **Trend:** Similar overall blue dominance, but with more pronounced light blue and yellow cells compared to the first heatmap, indicating higher absolute reward sums.
* **Data Points (Approximate):**
* The `TS/TS` row is notably lighter, with values likely in the 60-90 range against many opponents.
* The `Comp.` agent also shows relatively high reward sums (light blue, ~40-70) against several agents like `SARSA`, `DQN`, and `TS/TS`.
* The diagonal is not uniformly the lowest; some self-pairings (e.g., `QL` vs. `QL`) show moderate reward sums.
**3. Percentage of Cooperation Heatmap:**
* **Trend:** This map shows a clear pattern. The upper triangle (above the diagonal) is predominantly dark red (low cooperation, ~40-50%), while the lower triangle is predominantly light yellow (high cooperation, ~90-100%).
* **Data Points (Approximate):**
* **High Cooperation (Lower Triangle):** Pairs where the row agent is "below" the column agent in the list (e.g., `SARSA` vs. `UCB`, `DQN` vs. `QL`) show cooperation near 100%.
* **Low Cooperation (Upper Triangle):** The inverse pairs (e.g., `UCB` vs. `SARSA`, `QL` vs. `DQN`) show cooperation near 40-50%.
* The diagonal cells are mixed, with some showing high and others showing moderate cooperation.
**4. Relative Rewards (Competition) Heatmap:**
* **Trend:** A diverging pattern. The upper triangle is mostly red (negative relative reward, meaning the row agent loses to the column agent), and the lower triangle is mostly blue (positive relative reward, meaning the row agent wins).
* **Data Points (Approximate):**
* **Strongest Negative (Dark Red, ~-8 to -10):** `UCB` vs. `TS/TS`, `eGreedy` vs. `TS/TS`.
* **Strongest Positive (Dark Blue, ~+8 to +10):** `TS/TS` vs. `UCB`, `TS/TS` vs. `eGreedy`.
* The `TS/TS` agent shows a strong blue column (wins against most) and a strong red row (loses to few, if any).
* The `Comp.` agent shows mixed results, with blues and reds scattered.
### Key Observations
1. **Asymmetry in Cooperation:** The most striking pattern is the near-perfect asymmetry in the cooperation heatmap. This suggests a hierarchical or sequential relationship between the agents, where cooperation is largely one-directional based on their ordering in the list.
2. **Dominance of TS/TS:** The `TS/TS` agent appears to be the strongest performer overall. It achieves high cumulative rewards, high reward sums, and dominates in relative reward (competition) against almost all other agents.
3. **Weakness of Early Algorithms:** Traditional algorithms like `UCB` and `eGreedy` appear at the top of the list and consistently show poor performance (dark colors) in reward metrics and lose in competition (red in the relative reward map) against more complex agents.
4. **Metric Correlation:** High cooperation percentage (lower triangle of heatmap 3) does not directly correlate with high reward for the cooperating agent. For example, `SARSA` cooperating with `UCB` (high cooperation) still results in low reward for `SARSA` (first heatmap).
### Interpretation
This set of heatmaps provides a comprehensive competitive and cooperative landscape analysis for 11 agents over 10,000 episodes (`M=10^4`). The data suggests a clear performance hierarchy.
The **asymmetric cooperation pattern** is particularly insightful. It implies the agent list is ordered by some measure of sophistication or "strength," where agents lower on the list (like `TS/TS`, `Comp.`) are willing to cooperate with those above them, but the reverse is not true. This could model scenarios where advanced agents exploit simpler ones by feigning cooperation.
The **dominance of `TS/TS`** (likely Thompson Sampling) aligns with its known effectiveness in balancing exploration and exploitation. Its strong performance across reward metrics and competition indicates it is a robust, top-tier algorithm in this specific multi-agent environment.
The **diverging competition heatmap** acts as a direct "win-loss" record. The clear red/blue split along the diagonal reinforces the hierarchical structure. The fact that `TS/TS` has a nearly all-blue column (except against itself) is a definitive visual indicator of its superiority in this test.
In summary, these visualizations move beyond simple average rewards to reveal the nuanced, pairwise dynamics of competition and cooperation. They show that agent performance is highly context-dependent (i.e., dependent on the specific opponent) and that simple metrics like "percentage of cooperation" can mask underlying competitive inequalities. The ordering of agents on the axes appears to be a critical factor, reflecting a latent variable like algorithmic complexity or learning capability.
DECODING INTELLIGENCE...