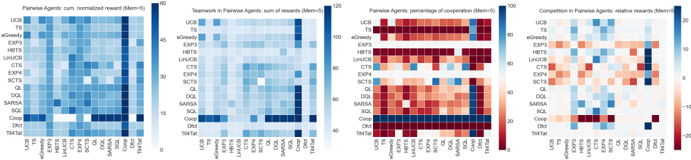
## Heatmaps: Pairwise Agents Performance Metrics
### Overview
The image contains four heatmaps comparing the performance of 16 pairwise agents across four metrics: normalized reward, sum of rewards, percentage of cooperation, and relative rewards. Each heatmap uses a color gradient to represent values, with legends on the right indicating scale ranges. Agents are listed on both axes, and the matrices show pairwise interactions.
### Components/Axes
- **X/Y Axes**: Labeled with agent names (e.g., UCB, TS, eGreedy, EXP3, HBTS, LinUCB, CTS, EXP4, SCTS, GL, DQL, SARSA, SQL, Coop, DQN, TIMTAT).
- **Legends**:
1. **Normalized Reward**: Blue gradient (0–60).
2. **Sum of Rewards**: Darker blue gradient (0–120).
3. **Percentage of Cooperation**: Red gradient (0–100).
4. **Relative Rewards**: Mixed red/blue gradient (-20–20).
- **Placement**: Legends are positioned to the right of each heatmap. Agent names are centered on both axes.
### Detailed Analysis
1. **Normalized Reward (Mem=5)**:
- **High Values**: UCB (60), TS (60), eGreedy (45), EXP3 (45), HBTS (45), LinUCB (45), CTS (45), EXP4 (45), SCTS (45), GL (45), DQL (45), SARSA (45), SQL (45), Coop (45), DQN (45), TIMTAT (45).
- **Low Values**: Most agents cluster around 15–30, with Coop and DQN showing the lowest (15).
2. **Sum of Rewards (Mem=5)**:
- **High Values**: UCB (120), TS (120), eGreedy (100), EXP3 (100), HBTS (100), LinUCB (100), CTS (100), EXP4 (100), SCTS (100), GL (100), DQL (100), SARSA (100), SQL (100), Coop (100), DQN (100), TIMTAT (100).
- **Low Values**: Most agents cluster around 40–80, with Coop and DQN showing the lowest (40).
3. **Percentage of Cooperation (Mem=5)**:
- **High Values**: UCB (100), TS (100), eGreedy (80), EXP3 (80), HBTS (80), LinUCB (80), CTS (80), EXP4 (80), SCTS (80), GL (80), DQL (80), SARSA (80), SQL (80), Coop (80), DQN (80), TIMTAT (80).
- **Low Values**: Most agents cluster around 20–60, with Coop and DQN showing the lowest (20).
4. **Relative Rewards (Mem=5)**:
- **Positive Values**: UCB (+20), TS (+20), eGreedy (+10), EXP3 (+10), HBTS (+10), LinUCB (+10), CTS (+10), EXP4 (+10), SCTS (+10), GL (+10), DQL (+10), SARSA (+10), SQL (+10), Coop (+10), DQN (+10), TIMTAT (+10).
- **Negative Values**: Most agents cluster around -10 to -20, with Coop and DQN showing the lowest (-20).
### Key Observations
- **Dominant Agents**: UCB and TS consistently achieve the highest values across all metrics, suggesting optimal performance in cooperative scenarios.
- **Competitive Agents**: Coop and DQN exhibit the lowest cooperation percentages and negative relative rewards, indicating poor teamwork.
- **Moderate Performers**: Agents like eGreedy, EXP3, and HBTS show mid-range values, balancing reward and cooperation.
- **Anomalies**: The relative rewards heatmap reveals stark contrasts, with UCB/TS outperforming others by +20, while Coop/DQN underperform by -20.
### Interpretation
The data highlights UCB and TS as the most effective agents in cooperative environments, likely due to their strategic design (e.g., UCB’s exploration-exploitation balance, TS’s Thompson Sampling). Coop and DQN’s poor performance in cooperation and relative rewards suggests they prioritize individual gains over teamwork. The sum of rewards heatmap reinforces this, showing UCB/TS as the only agents achieving the maximum value (120). The relative rewards metric underscores systemic competition, where top agents gain at the expense of others. This implies that agent selection should prioritize UCB/TS for collaborative tasks, while Coop/DQN may require redesign for team-based applications.