## Line Chart: Transfer Time per ID vs. ID Batch Size for Different Feedback Frequencies
### Overview
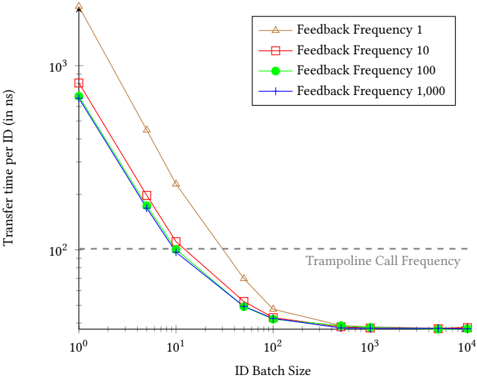
The image is a line chart comparing the transfer time per ID (in nanoseconds) against the ID batch size for four different feedback frequencies: 1, 10, 100, and 1,000. The x-axis (ID Batch Size) and y-axis (Transfer time per ID) are both logarithmically scaled. A horizontal dashed line indicates the "Trampoline Call Frequency."
### Components/Axes
* **X-axis:** ID Batch Size (logarithmic scale), with markers at 10<sup>0</sup> (1), 10<sup>1</sup> (10), 10<sup>2</sup> (100), 10<sup>3</sup> (1,000), and 10<sup>4</sup> (10,000).
* **Y-axis:** Transfer time per ID (in ns) (logarithmic scale), with markers at 10<sup>1</sup> (10), 10<sup>2</sup> (100), and 10<sup>3</sup> (1,000).
* **Legend (top-right):**
* Tan line with triangles: Feedback Frequency 1
* Red line with squares: Feedback Frequency 10
* Green line with circles: Feedback Frequency 100
* Blue line with plus signs: Feedback Frequency 1,000
* **Horizontal dashed line:** Labeled "Trampoline Call Frequency" at approximately 100 ns.
### Detailed Analysis
* **Feedback Frequency 1 (Tan line with triangles):** The transfer time decreases sharply from approximately 2000 ns at a batch size of 1 to approximately 30 ns at a batch size of 100. It then decreases more gradually, reaching approximately 15 ns at a batch size of 10,000.
* (1, ~2000)
* (10, ~300)
* (100, ~30)
* (1000, ~20)
* (10000, ~15)
* **Feedback Frequency 10 (Red line with squares):** The transfer time decreases from approximately 700 ns at a batch size of 1 to approximately 20 ns at a batch size of 100. It then plateaus around 15 ns.
* (1, ~700)
* (10, ~120)
* (100, ~20)
* (1000, ~15)
* (10000, ~15)
* **Feedback Frequency 100 (Green line with circles):** The transfer time decreases from approximately 500 ns at a batch size of 1 to approximately 20 ns at a batch size of 100. It then plateaus around 15 ns.
* (1, ~500)
* (10, ~100)
* (100, ~20)
* (1000, ~15)
* (10000, ~15)
* **Feedback Frequency 1,000 (Blue line with plus signs):** The transfer time decreases from approximately 500 ns at a batch size of 1 to approximately 20 ns at a batch size of 100. It then plateaus around 15 ns.
* (1, ~500)
* (10, ~100)
* (100, ~20)
* (1000, ~15)
* (10000, ~15)
### Key Observations
* The transfer time per ID decreases as the ID batch size increases for all feedback frequencies.
* The "Feedback Frequency 1" line has a significantly higher transfer time per ID at smaller batch sizes compared to the other frequencies.
* For batch sizes greater than 100, the transfer time per ID converges to approximately 15 ns for Feedback Frequencies 10, 100, and 1,000.
* The "Trampoline Call Frequency" is at approximately 100 ns.
### Interpretation
The chart illustrates the relationship between ID batch size and transfer time per ID for different feedback frequencies. The data suggests that increasing the ID batch size reduces the transfer time per ID, likely due to amortizing overhead costs across a larger batch. The "Feedback Frequency 1" data series shows a much slower decrease in transfer time as batch size increases, indicating that a low feedback frequency is less efficient, especially at smaller batch sizes. The convergence of the other three lines suggests that there is a limit to the performance gains from increasing the batch size beyond a certain point, and that higher feedback frequencies offer similar performance at larger batch sizes. The "Trampoline Call Frequency" line provides a benchmark for evaluating the efficiency of the transfer times. The data implies that for batch sizes greater than 100, the transfer time is significantly lower than the trampoline call frequency, indicating efficient transfer operations.