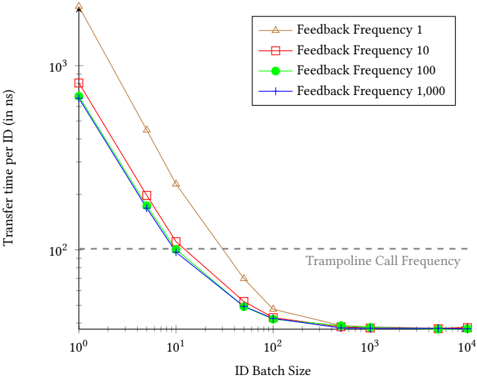
## Chart: Transfer Time vs. ID Batch Size for Different Feedback Frequencies
### Overview
The image presents a line chart illustrating the relationship between ID Batch Size and Transfer Time per ID (in nanoseconds) for four different Feedback Frequencies. The chart demonstrates how transfer time decreases as the ID Batch Size increases, with varying degrees of reduction depending on the feedback frequency. A horizontal dashed line represents the "Trampoline Call Frequency".
### Components/Axes
* **X-axis:** "ID Batch Size" - Logarithmic scale, ranging from approximately 10<sup>0</sup> to 10<sup>4</sup>. Markers are at 1, 10, 100, 1000, 10000.
* **Y-axis:** "Transfer time per ID (in ns)" - Logarithmic scale, ranging from approximately 10<sup>0</sup> to 10<sup>3</sup>. Markers are at 1, 10, 100, 1000.
* **Legend:** Located in the top-right corner.
* Feedback Frequency 1 (Orange, Triangle Markers)
* Feedback Frequency 10 (Red, Square Markers)
* Feedback Frequency 100 (Green, Diamond Markers)
* Feedback Frequency 1,000 (Blue, Circle Markers)
* **Horizontal Line:** Dashed grey line labeled "Trampoline Call Frequency" at approximately y = 10<sup>2</sup>.
### Detailed Analysis
Let's analyze each data series:
* **Feedback Frequency 1 (Orange):** This line starts at approximately y = 10<sup>3</sup> at x = 1, and slopes steeply downward, reaching approximately y = 20 at x = 100, and leveling off around y = 10 at x = 1000 and x = 10000.
* **Feedback Frequency 10 (Red):** This line begins at approximately y = 10<sup>3</sup> at x = 1, and decreases more gradually than the orange line, reaching approximately y = 80 at x = 100, y = 30 at x = 1000, and y = 15 at x = 10000.
* **Feedback Frequency 100 (Green):** This line starts at approximately y = 10<sup>2</sup> at x = 1, and decreases rapidly to approximately y = 20 at x = 10, y = 10 at x = 100, and remains relatively flat around y = 5 at x = 1000 and x = 10000.
* **Feedback Frequency 1,000 (Blue):** This line begins at approximately y = 10<sup>2</sup> at x = 1, and decreases quickly to approximately y = 10 at x = 10, y = 5 at x = 100, and remains nearly flat around y = 2 at x = 1000 and x = 10000.
### Key Observations
* All lines exhibit a decreasing trend, indicating that increasing the ID Batch Size reduces the Transfer Time per ID.
* The Feedback Frequency 1 line shows the most significant reduction in transfer time initially, but its rate of decrease slows down at larger batch sizes.
* The Feedback Frequency 100 and 1,000 lines converge at larger batch sizes, suggesting that at very large batch sizes, the feedback frequency has minimal impact on transfer time.
* The "Trampoline Call Frequency" line appears to be a performance threshold. The lines with higher feedback frequencies (100 and 1000) fall below this line at larger batch sizes, indicating potentially better performance.
### Interpretation
The data suggests that increasing the ID Batch Size is an effective strategy for reducing transfer time per ID. The optimal feedback frequency depends on the batch size. At smaller batch sizes, a lower feedback frequency (e.g., 1) may be sufficient, but as the batch size increases, higher feedback frequencies (e.g., 100 or 1000) become more beneficial, potentially surpassing the "Trampoline Call Frequency" threshold and achieving better performance. The convergence of the lines at larger batch sizes indicates a point of diminishing returns, where increasing the feedback frequency further does not significantly improve transfer time. This could be due to other bottlenecks in the system. The logarithmic scales on both axes suggest that the relationship between batch size and transfer time is not linear, and that the benefits of increasing batch size are most pronounced at smaller batch sizes. The "Trampoline Call Frequency" likely represents a system overhead or a limit imposed by the underlying architecture.