## Line Chart: Transfer Time per ID vs. ID Batch Size for Different Feedback Frequencies
### Overview
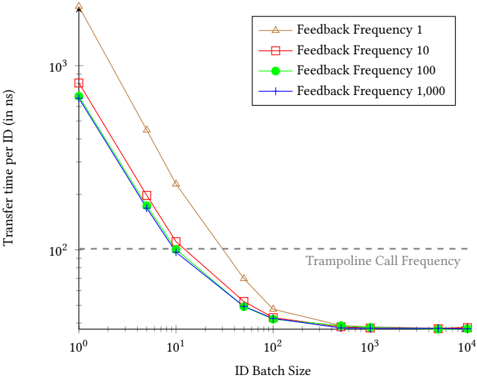
This is a line chart plotted on a logarithmic scale for both axes. It illustrates the relationship between the "ID Batch Size" (x-axis) and the "Transfer time per ID (in ns)" (y-axis) for four different experimental conditions labeled as "Feedback Frequency" 1, 10, 100, and 1,000. The chart demonstrates how increasing the batch size reduces the per-unit transfer time, with all conditions converging toward a common baseline.
### Components/Axes
* **Chart Type:** Line chart with markers.
* **X-Axis:**
* **Label:** `ID Batch Size`
* **Scale:** Logarithmic (base 10).
* **Range & Ticks:** From `10^0` (1) to `10^4` (10,000). Major ticks are at `10^0`, `10^1`, `10^2`, `10^3`, `10^4`.
* **Y-Axis:**
* **Label:** `Transfer time per ID (in ns)`
* **Scale:** Logarithmic (base 10).
* **Range & Ticks:** From `10^2` (100) to `10^3` (1000). Major ticks are at `10^2` and `10^3`. Minor ticks are present between them.
* **Legend:**
* **Position:** Top-right corner of the plot area.
* **Series:**
1. `Feedback Frequency 1`: Brown line with upward-pointing triangle markers.
2. `Feedback Frequency 10`: Red line with square markers.
3. `Feedback Frequency 100`: Green line with circle markers.
4. `Feedback Frequency 1,000`: Blue line with plus sign (`+`) markers.
* **Reference Line:**
* A horizontal, gray, dashed line is drawn at `y = 10^2` (100 ns).
* **Label:** `Trampoline Call Frequency` is written just below this line on the right side of the chart.
### Detailed Analysis
**Trend Verification:** All four data series show a strong downward trend. As the ID Batch Size increases, the Transfer time per ID decreases sharply at first and then flattens out, approaching an asymptote.
**Data Point Extraction (Approximate Values):**
* **Feedback Frequency 1 (Brown Triangle):**
* Batch Size 1: ~1500 ns (highest starting point).
* Batch Size 10: ~300 ns.
* Batch Size 100: ~120 ns.
* Batch Size 1000: ~100 ns.
* Batch Size 10000: ~100 ns.
* **Feedback Frequency 10 (Red Square):**
* Batch Size 1: ~800 ns.
* Batch Size 10: ~110 ns.
* Batch Size 100: ~100 ns.
* Batch Size 1000: ~100 ns.
* Batch Size 10000: ~100 ns.
* **Feedback Frequency 100 (Green Circle):**
* Batch Size 1: ~700 ns.
* Batch Size 10: ~100 ns.
* Batch Size 100: ~100 ns.
* Batch Size 1000: ~100 ns.
* Batch Size 10000: ~100 ns.
* **Feedback Frequency 1,000 (Blue Plus):**
* Batch Size 1: ~700 ns (very close to the green line).
* Batch Size 10: ~100 ns.
* Batch Size 100: ~100 ns.
* Batch Size 1000: ~100 ns.
* Batch Size 10000: ~100 ns.
**Convergence:** All four lines converge and become nearly indistinguishable at a transfer time of approximately **100 ns** for batch sizes of **100 and larger**. This convergence point aligns perfectly with the horizontal "Trampoline Call Frequency" reference line.
### Key Observations
1. **Initial Performance Gap:** At the smallest batch size (1), there is a significant performance gap. `Feedback Frequency 1` has a transfer time nearly double that of the other three frequencies.
2. **Rapid Improvement:** The most dramatic reduction in transfer time occurs between batch sizes of 1 and 100. The slope is steepest for `Feedback Frequency 1`.
3. **Diminishing Returns:** Beyond a batch size of approximately 100, increasing the batch size further yields negligible improvement in per-ID transfer time for any feedback frequency.
4. **Baseline Performance:** The "Trampoline Call Frequency" at 100 ns appears to represent a fundamental performance floor or baseline cost that cannot be reduced further by batching, regardless of the feedback frequency setting.
### Interpretation
This chart demonstrates a classic performance optimization principle: **amortizing fixed overhead costs over larger batches.** The "Transfer time per ID" likely includes a fixed overhead component (e.g., communication setup, context switching) that is paid once per batch. As the batch size grows, this fixed cost is divided among more IDs, reducing the per-unit time.
The "Feedback Frequency" parameter significantly impacts the fixed overhead. A lower frequency (e.g., 1) incurs a much higher initial overhead, making small batches very inefficient. Higher feedback frequencies (10, 100, 1000) have a lower, similar overhead, leading to better small-batch performance.
The convergence at the "Trampoline Call Frequency" line suggests that once the fixed overhead is fully amortized, the remaining cost is a variable, per-ID processing time (the "trampoline call" itself) that is independent of both batch size and feedback frequency. This represents the irreducible minimum time required to process a single ID.
**Practical Implication:** To achieve optimal performance (near 100 ns per ID), one should use a batch size of at least 100. Using a batch size smaller than 100, especially with a low feedback frequency, results in significantly higher latency. The choice of feedback frequency (10 vs. 100 vs. 1000) matters little for large batches but is critical for performance if small batches are unavoidable.