## Line Graph: Transfer Time per ID vs. ID Batch Size
### Overview
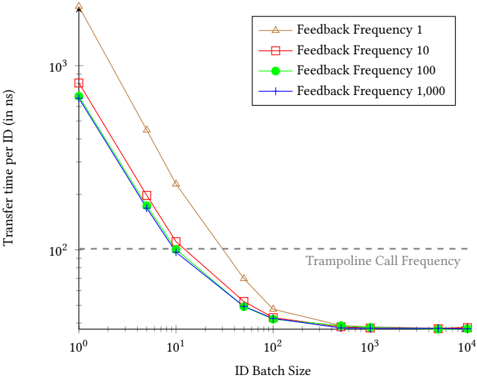
The image is a logarithmic line graph comparing transfer time per ID (in nanoseconds) across different ID batch sizes (10⁰ to 10⁴). Four data series represent feedback frequencies (1, 10, 100, 1000), with a horizontal dashed reference line labeled "Trampoline Call Frequency" at 10² ns.
### Components/Axes
- **X-axis**: "ID Batch Size" (logarithmic scale: 10⁰ to 10⁴)
- **Y-axis**: "Transfer time per ID (in ns)" (logarithmic scale: 10⁰ to 10³)
- **Legend**: Located in the top-right corner, with symbols and colors:
- **Triangle (brown)**: Feedback Frequency 1
- **Square (red)**: Feedback Frequency 10
- **Circle (green)**: Feedback Frequency 100
- **Cross (blue)**: Feedback Frequency 1000
- **Dashed Line**: "Trampoline Call Frequency" at 10² ns (horizontal, gray)
### Detailed Analysis
1. **Feedback Frequency 1 (Triangle)**:
- Starts at ~10³ ns for batch size 10⁰.
- Declines steeply, reaching ~10² ns at batch size 10¹.
- Continues downward, approaching ~10¹ ns at batch size 10².
- Flattens near ~10⁰ ns at batch size 10³–10⁴.
2. **Feedback Frequency 10 (Square)**:
- Begins at ~10² ns for batch size 10⁰.
- Decreases gradually, reaching ~10¹ ns at batch size 10¹.
- Flattens near ~10⁰ ns at batch size 10²–10⁴.
3. **Feedback Frequency 100 (Circle)**:
- Starts at ~10¹ ns for batch size 10⁰.
- Declines slowly, reaching ~10⁰ ns at batch size 10¹.
- Remains near ~10⁰ ns for larger batch sizes.
4. **Feedback Frequency 1000 (Cross)**:
- Begins at ~10⁰ ns for batch size 10⁰.
- Stays near ~10⁰ ns across all batch sizes.
5. **Trampoline Call Frequency**:
- Horizontal dashed line at 10² ns.
- All lines intersect or approach this threshold at batch size 10¹.
### Key Observations
- **Inverse Relationship**: Higher feedback frequencies correlate with lower transfer times.
- **Divergence at Small Batches**: Feedback Frequency 1 (triangle) has the highest transfer time at small batch sizes (10⁰–10¹).
- **Convergence at Large Batches**: All lines converge near ~10⁰ ns for batch sizes ≥10³.
- **Trampoline Threshold**: The 10² ns reference line acts as a performance benchmark, with lower frequencies (1, 10) crossing it at batch size 10¹.
### Interpretation
The data demonstrates that increasing feedback frequency significantly reduces transfer time per ID, particularly at smaller batch sizes. Feedback Frequency 1 (triangle) exhibits the steepest decline, suggesting it is the least efficient at low batch sizes but improves with scale. Conversely, higher frequencies (1000) achieve near-optimal performance even at small batches. The convergence at large batch sizes implies diminishing returns for further frequency increases. The "Trampoline Call Frequency" line highlights a critical performance threshold, with lower frequencies requiring larger batch sizes to meet this benchmark. This suggests a trade-off between feedback frequency and batch size optimization for efficiency.