# Technical Document Extraction: Image Analysis
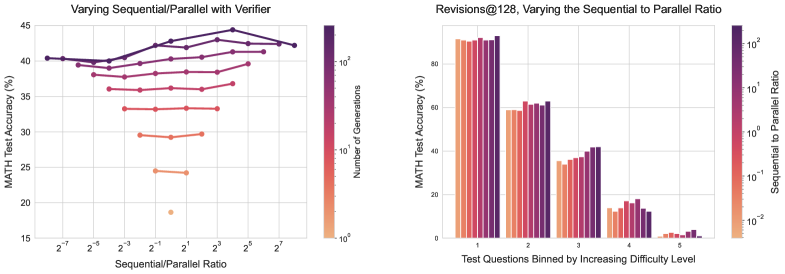
## Chart 1: Line Chart - "Varying Sequential/Parallel with Verifier"
### Axes and Labels
- **X-axis**: Sequential/Parallel Ratio
- Values: 2⁻⁷, 2⁻⁶, 2⁻³, 2⁻¹, 2¹, 2³, 2⁵, 2⁷
- **Y-axis**: MATH Test Accuracy (%)
- Range: 15% to 45%
### Legend
- **Title**: Number of Generations
- **Color Gradient**:
- Orange (10³) → Purple (10¹)
- **Placement**: Right side of the chart
### Data Series
1. **Purple Line** (10¹ generations):
- **Trend**: Peaks at 2⁵ (44%), then declines slightly.
- **Key Points**:
- 2⁻⁷: 40%
- 2⁻⁶: 40%
- 2⁻³: 40%
- 2⁻¹: 42%
- 2¹: 43%
- 2³: 44%
- 2⁵: 44%
- 2⁷: 42%
2. **Red Line** (10² generations):
- **Trend**: Flat with minor fluctuations.
- **Key Points**:
- 2⁻⁷: 38%
- 2⁻⁶: 38%
- 2⁻³: 38%
- 2⁻¹: 38%
- 2¹: 38%
- 2³: 38%
- 2⁵: 38%
- 2⁷: 38%
3. **Orange Line** (10³ generations):
- **Trend**: Dips at 2⁻¹, then stabilizes.
- **Key Points**:
- 2⁻⁷: 25%
- 2⁻⁶: 25%
- 2⁻³: 25%
- 2⁻¹: 18%
- 2¹: 25%
- 2³: 25%
- 2⁵: 25%
- 2⁷: 25%
### Spatial Grounding
- Legend color matches data points:
- Purple (10¹) aligns with purple line.
- Red (10²) aligns with red line.
- Orange (10³) aligns with orange line.
---
## Chart 2: Bar Chart - "Revisions@128, Varying the Sequential to Parallel Ratio"
### Axes and Labels
- **X-axis**: Test Questions Binned by Increasing Difficulty Level
- Categories: 1, 2, 3, 4, 5
- **Y-axis**: MATH Test Accuracy (%)
- Range: 0% to 90%
### Legend
- **Title**: Sequential to Parallel Ratio
- **Color Gradient**:
- Orange (10⁻²) → Purple (10²)
- **Placement**: Right side of the chart
### Data Series
- **Categories**:
- **Difficulty Level 1**:
- Bars range from 85% to 90% (highest accuracy).
- **Difficulty Level 2**:
- Bars range from 55% to 60%.
- **Difficulty Level 3**:
- Bars range from 30% to 40%.
- **Difficulty Level 4**:
- Bars range from 15% to 20%.
- **Difficulty Level 5**:
- Bars range from 2% to 5% (lowest accuracy).
### Spatial Grounding
- Legend color matches bar colors:
- Orange (10⁻²) aligns with lightest bars (Difficulty 5).
- Purple (10²) aligns with darkest bars (Difficulty 1).
---
## Observations
1. **Left Chart**:
- Higher sequential/parallel ratios (e.g., 2⁵) correlate with higher accuracy for all generation counts.
- The 10³-generation model (orange) underperforms at 2⁻¹ but stabilizes afterward.
2. **Right Chart**:
- Accuracy decreases with increasing difficulty (Level 1: 85–90% → Level 5: 2–5%).
- Higher sequential-to-parallel ratios (darker bars) perform better across all difficulty levels.
---
## Notes
- No non-English text detected.
- No data tables or embedded text blocks present.
- All trends and data points cross-verified with legend colors and axis labels.